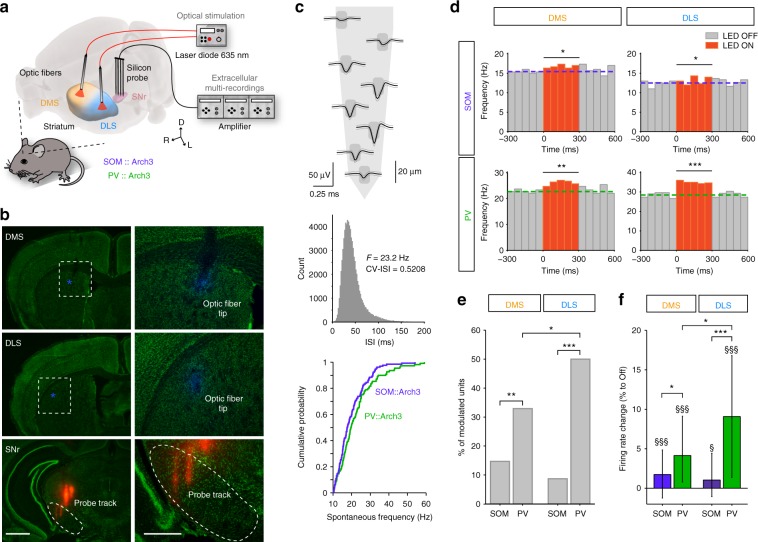
Fig. 1.
Differential modulation of basal ganglia output activity by SOM and PV cells of DMS and DLS. a Experimental set up: in vivo multi-channel extracellular recordings of SNr unit activity using 4-shank 32-site silicon probe while PV or SOM interneurons are opto-inhibited using two optic fibers implanted in the DMS and DLS. b Post-hoc histological confirmation of the location of the recording probe (shanks painted with DiI before the implantation, red) in the SNr (delineated) and the two optic fibers (tips painted with DAPI, blue) in DMS and DLS, observed in Nissl-stained (green) coronal slices. Scale bars: 1 mm (left), 500 µm (right). c Top: Mean ± SD (black and gray lines) waveform of a clustered SNr unit represented atop the corresponding recording sites of the probe (sketch of 1 shank, the 8 recording sites in dark gray). Middle: Distribution of the interspike interval (ISI) of the same unit, displaying the high frequency and low CV-ISI typical of SNr units. Bottom: the distribution of SNr spontaneous firing rates is similar in SOM::Arch3 mice (n = 130 units from 17 mice) and PV::Arch3 mice (n = 109 units from 13 mice) (Kolmogorov–Smirnov test, p = 0.2044). d Spontaneous firing activity of representative SNr units significantly activated by opto-inhibition (300 ms, 10 mW, 50 trials) of SOM (top) or PV (bottom) light in DMS (left) or DLS (right). The colored dashed lines represent the median of the 300 ms-OFF period before the stimulation. e Proportion of SNr units displaying a significant modulation of their firing in response to opto-inhibition of PV or SOM interneurons in DMS or DLS (total n = 109 units for SOM::Arch3 in DMS, n = 69 in DLS, n = 79 units for PV::Arch3 mice in DMS, n = 68 in DLS). f Median (IQR) change in firing rate of all recorded SNr units in response to opto-inhibition of PV (green) and SOM (purple) interneurons in the DMS and DLS. §§§Indicates a significant effect across the population of recorded SNr units for PV-DLS ($p < 0.05, $$$p < 0.001, Wilcoxon signed rank test corrected for multiple comparisons). In e and f, results in the 4 conditions were compared using a generalized linear (e) or a linear (f) model (see Methods) followed by post-hoc tests, *p < 0.05, **p < 0.01, ***p < 0.001. For the 3D images in a, brain and brain structures are captured from the Allen Institute for Brain Science’s Mouse Brain Atlas74 (© 2004 Allen Institute for Brain Science, Allen Mouse Brain Atlas available from: mouse.brain-map.org/) using Brain Explorer®275

