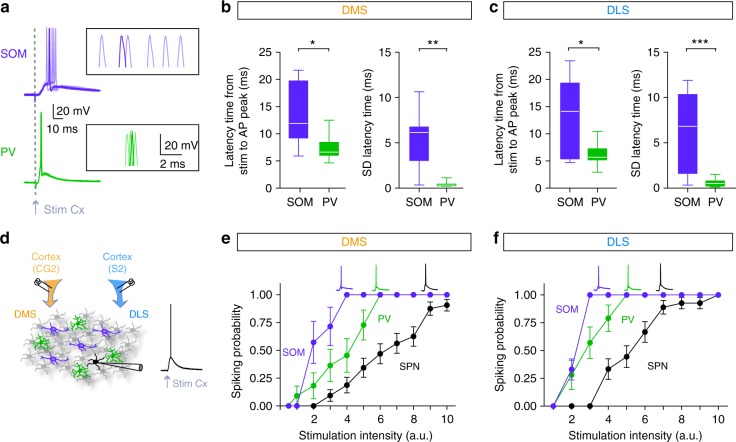
Fig. 2.
SOM and PV cells are differentially recruited by cortical inputs in DMS and DLS. a Six superimposed APs evoked in either SOM or PV cells for a given cortical stimulation intensity. b, c Whisker boxes representing the latency, and the standard deviation (SD) of the latency, between the stimulation artifact and the peak of the AP in PV cells (green) and SOM cells (purple), in DMS and DLS. In both territories, PV interneurons display much shorter latency and SD than SOM cells, (DMS, p = 0.0148 for latency and p = 0.0019 for SD; DLS, p = 0.0334 for latency and p = 0.0004 for SD). PV cells display a short latency (6.38 ± 0.38 ms, n = 30) and a remarkable small SD of the latency (0.53 ± 0.07 ms, n = 30), and this with no significant difference between DMS and DLS (p = 0.1127 for latency and p = 0.4641 for SD latency), accounting for a very time-locked PV cells recruitment. In contrast, APs evoked in SOM cells by cortical stimulation exhibited longer latency (13.31 ± 1.77 ms, n = 17) and a higher latency SD (5.75 ± 0.93 ms, n = 17), with no difference in DMS and DLS (p = 0.8884 for latency and p = 0.7430 for SD latency, Mann–Whitney unpaired t-test). d Schematic representation of the experimental set up: electrical stimulations were applied in the cortex (CG2 for DMS slices and S2 for DLS slices) and evoked APs were recorded in SPNs, PV and SOM cells. e, f Input/output relationship (mean ± SEM) is plotted for different neuronal subtypes, SPN (black), PV cells (green) and SOM cells (purple) in DMS (e) and DLS (f). Insets represent APs evoked in the different cell types after cortical stimulation. In both DLS and DMS, PV and SOM cells discharge for much lower cortical activation than SPNs (F2, 20 = 20.19, p < 0.0001 for DMS, SPN n = 33, PV n = 11, SOM n = 8 and F2, 18 = 11.17, p = 0.0025 for DLS, SPN n = 27, PV n = 14, SOM n = 8, two-way ANOVA); *p < 0.05, **p < 0.01, ***p < 0.001

