Fig. 5.
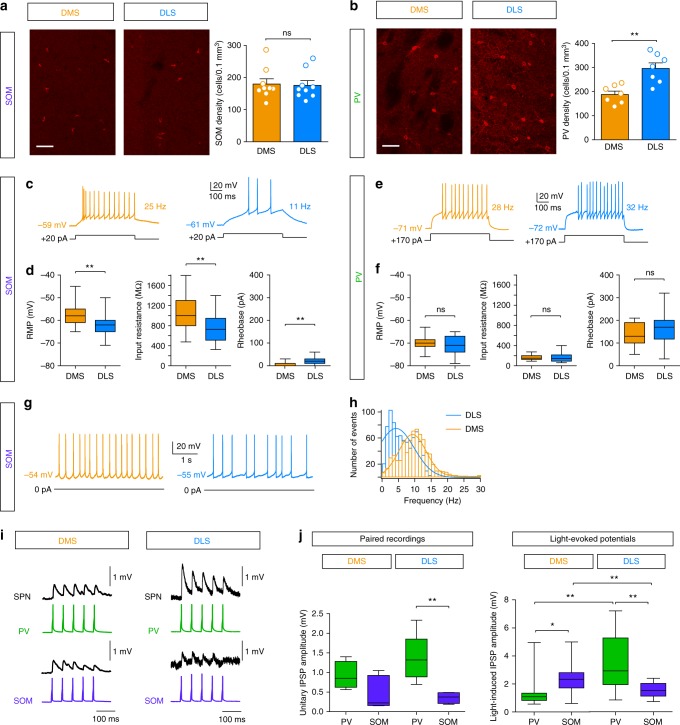
Heterogeneous distribution, electrical properties and connectivity of SOM and PV cells in DMS and DLS. a, b Confocal microscopy images showing a representative overview of SOM (a) and PV (b) interneuron expression in DMS and DLS (scale bars: 50 µm), identified following immunostainings. On the right panels, quantification of SOM (a) and PV (b) interneurons in DMS and DLS is represented by the cell density (number of cells per 0.1 mm3) of SOM and PV interneurons in each territory (n = 9 mice for SOM interneurons and n = 7 mice for PV interneurons). c Representative responses of SOM cells to identical current steps (+20 pA) in DLS and DMS. d Membrane and electrical properties of SOM cells in DMS (orange, n = 20) and DLS (blue, n = 27) (mean ± SEM). e Representative responses of PV cells to identical current steps (+170 pA) in DLS and DMS. f Membrane and electrical properties of PV cells in DMS (orange, n = 17) and DLS (blue, n = 30). There is no significant difference in rheobase (p = 0.2761), RMP (p = 0.6030) and input resistance (p = 0.3260) of PV cells in DMS or in DLS. g Representative spontaneous activity of SOM cells in DMS and DLS. h Distribution and Gaussian fits of the discharge frequency in DLS (100 action potentials per cell, n = 8) and DMS (n = 6): the frequency is significantly higher in DMS (p < 0.0001). i Representative connections between of PV-SPN and SOM-SPN connections in DMS and DLS in response to 20 Hz single AP trains evoked in PV and SOM cells with current injections. j Amplitude of unitary IPSPs in a SPN (single AP with paired patch-clamp recordings) in DMS and DLS. For PV-SPN connections the unitary IPSP was median (interquartile range (IQR)): 0.9 (0.6) mV (n = 5) in DMS and 1.3 (0.7) mV in DLS (n = 6) and for SOM-SPN connections 0.3 (0.8) mV (n = 6) in DMS and 0.4 (0.2) mV in DLS (n = 4). They were not statistically different in DMS (p = 0.0648) but much stronger from PV in DLS (p = 0.0094). Concerning light-induced IPSP amplitudes, SOM cell opto-activation induced significantly stronger IPSPs in DMS (p = 0.0158) and PV cells in DLS (p = 0.0019) (SOM-DMS: 2.3 (1.1) mV, n = 19, PV-DMS: 1.1 (0.5) mV, n = 16, SOM-DLS: 1.5 (1.1) mV, n = 14, and PV-DLS: 2.9 (3.2) mV, n = 15). *p < 0.05, **p < 0.01, ns not significant

