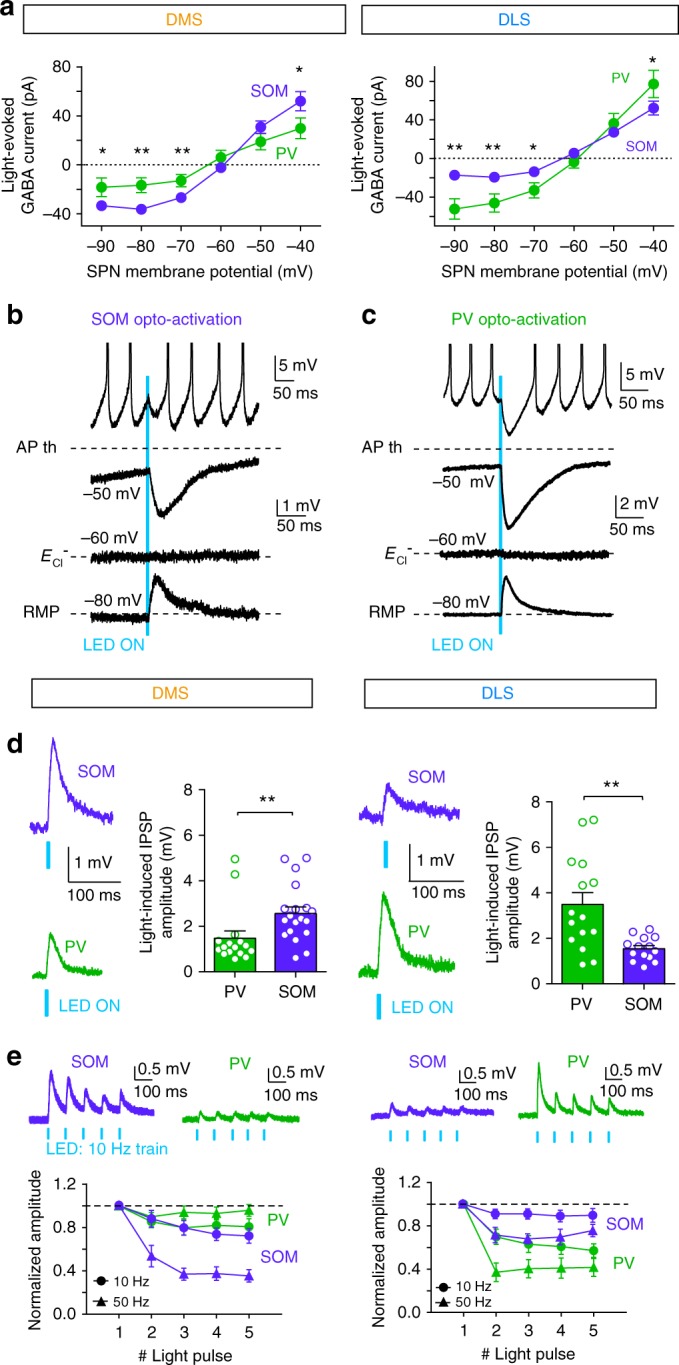
Fig. 6.

Dual effect of SOM and PV cells depending on the state of SPNs. a Current/voltage relationship of the light-evoked responses recorded in DMS and DLS after opto-activation of PV (green) or SOM (purple) cells. There are significant differences in the light-induced GABA currents between PV and SOM cells activation at −90, −80, −70 and −40 mV in DMS and DLS. b, c Representative traces of light-induced PSPs in SPNs evoked by short opto-activation (5 ms light pulses) of either SOM (b) or PV cells (c). Responses are recorded in SPNs held at different potentials (−80, −60 and −50 mV) or in spiking SPN (APs are truncated for clarity of the figure). d, e In DMS and DLS, synaptic weight of SOM or PV cells on SPNs were evaluated in SPNs maintained at their RMP (~−80 mV). Amplitudes of IPSPs induced by a single pulse (d) or trains of light pulses (e) were evaluated. d In DMS, single light pulse induces IPSPs with significantly (p = 0.0022) larger amplitude in SPNs after SOM cell opto-activation (purple traces, n = 19 cells) than after PV cell opto-activation (green traces, n = 16 cells). In DLS, opto-activation of PV cells (n = 14) induces significantly (p = 0.0043) larger IPSPs in SPNs than SOM cell opto-activation (n = 14). e Representative responses recorded in SPNs after opto-activation of SOM cells (purple traces) and PV (green traces) with 10 Hz trains of 5 ms light pulses. Short-term dynamics of IPSPs induced by trains of light pulses at 10 or 50 Hz after SOM cell (purple traces, n = 7 cells in DMS and n = 6 in DLS) or PV cell (green traces, n = 9 cells in DMS and n = 6 in DLS) activation. SOM-induced IPSPs display significantly stronger short-term depression at 10 (F1, 50 = 8.94, p = 0.0126, two-way ANOVA) and 50 Hz (F1, 50 = 44.22, p < 0.0001) in DMS compared to DLS. On the contrary, PV cells induce stronger short-term depression in DLS compared to DMS (F1, 80 = 11.97, p = 0.0001 for 10 Hz and F1, 70 = 41.94, p < 0.0001 for 50 Hz); *p < 0.05, **p < 0.01
