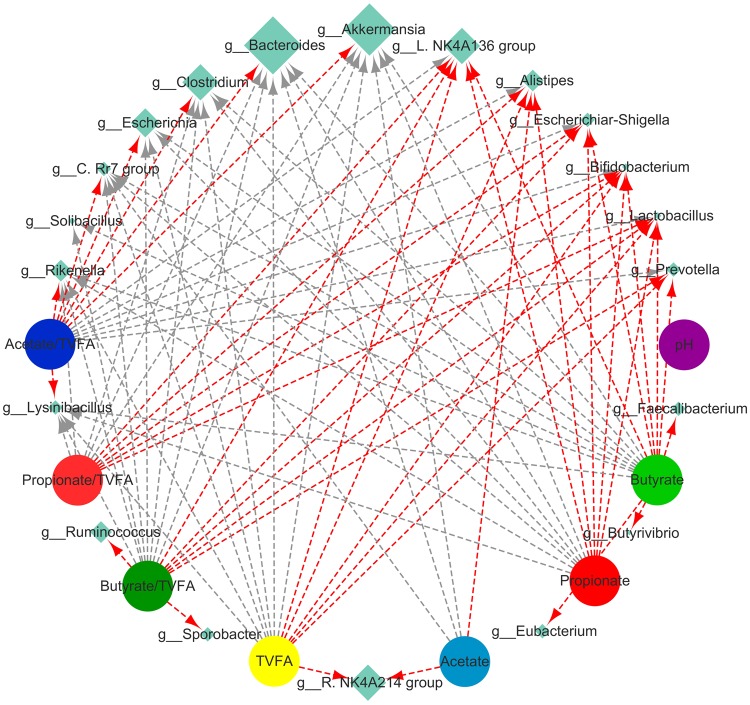
Figure 10.
Correlation analysis between the relative abundances of caecal bacterial genera and caecal fermentation parameters. The network is based on the coefficients from Pearson’s correlation analysis with an absolute association score greater than 0.60 (P < 0.05). The sizes of the diamonds indicate the mean average relative abundance of caecal bacteria genera. The red lines indicate a positive correlation and the grey lines indicates a negative correlation between caecal bacterial genera and caecal fermentation parameters.

