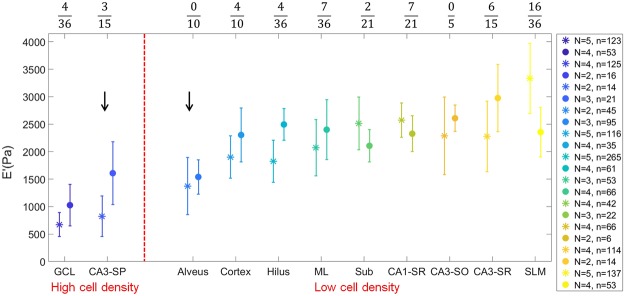
Figure 4.
Comparison of the weighted means of the storage modulus of different brain regions obtained with an oscillatory ramp (stars) or a frequency sweep (dots) approach at 7.3% strain and 5.62 Hz frequency. Error bars are SE of the weighted mean. The legend indicates the number of slices N used to calculate the weighted mean and the total number of measurement points n. The fraction on top indicates the number of significantly different pairs over the total number of pairs analyzed with post hoc test. Arrows indicate regions with high content of fibers. Red dashed line separates two groups with low and high Arel.

