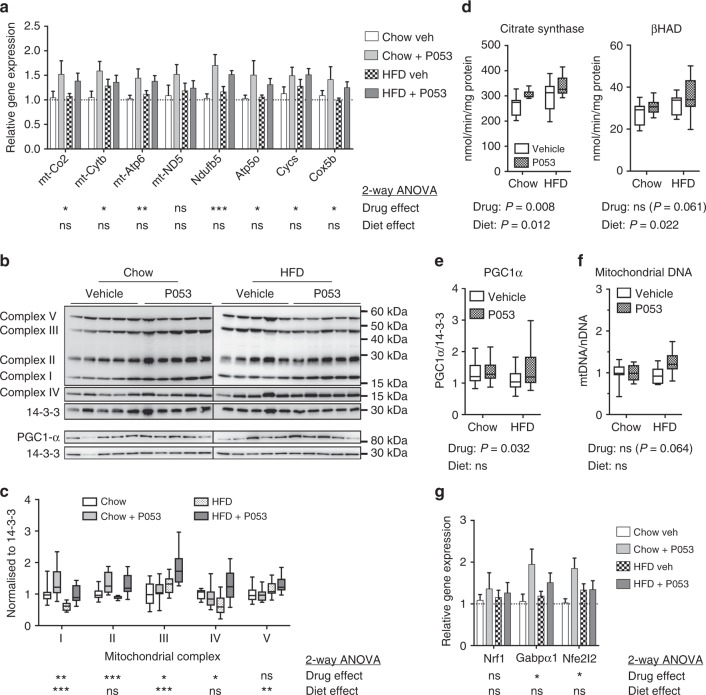
Fig. 6.
CerS1 inhibition increases mitochondrial markers in SkM. a Levels of mitochondrially (mt)- and nuclear-encoded respiratory complex subunits in SkM, as determined by real-time PCR; n = 9 for chow diet groups; n = 10 for HFD groups. b Western blots of respiratory complex subunits in SkM. c Densitometry for respiratory complex subunits relative to 14-3-3 protein. d Citrate synthase and β-hydroxyacyl coenzyme A dehydrogenase (βHAD) activity in SkM. b–d, n = 10 mice for all groups except the chow + P053 group, for which n = 8. e Western blot of PGC-1α protein levels with densitometry normalised to 14-3-3 protein, n = 18–20 mice per group. f Mitochondrial DNA (mtDNA) content, normalised to nuclear DNA (nDNA) and expressed relative to the mean of the control group; n = 10 mice for all groups except the chow + P053 group, for which n = 8. g Gene expression levels for regulators of mitochondrial biogenesis and function, as determined by real-time PCR; n = 8 for chow diet groups; n = 10 for HFD groups. a, g show mean ± SEM. Box and whisker plots show full data range with 25th–75th percentile boxed, and horizontal bar marking the median. Statistical significance was determined by two-way ANOVA, with the main effect of the drug or diet shown beneath each result; *P < 0.05; **P < 0.01; ***P < 0.001. Raw data for panels a and g is provided in Supplementary Data File 1

