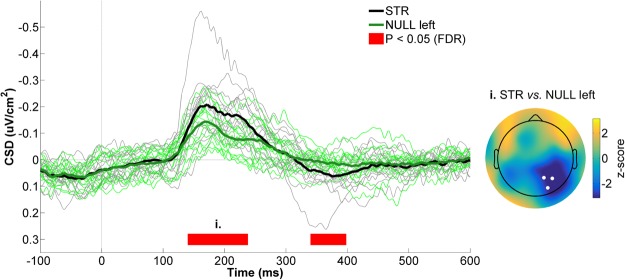
Figure 5.
CSD activity recorded at the right parietal ROI for STR vs. NULL left. The black and green waveforms respectively represent CSD activity for STR and NULL left. The thin waveforms represent individual participant data, whereas the thick waveforms represent the mean CSD activity across participants. The red line highlights the time bins showing statistically significant differences between STR and NULL left (p ≤ 0.05, FDR-corrected). Time “0 ms” corresponds to movement onset. The scalp map represents the statistical z-scores across electrodes for CSD activity between STR and NULL left during the significant time window (i., 140–240 ms). The electrodes that make up the right parietal ROI (P2, P4 and PO4) are highlighted in the scalp map.

