Fig. 1.
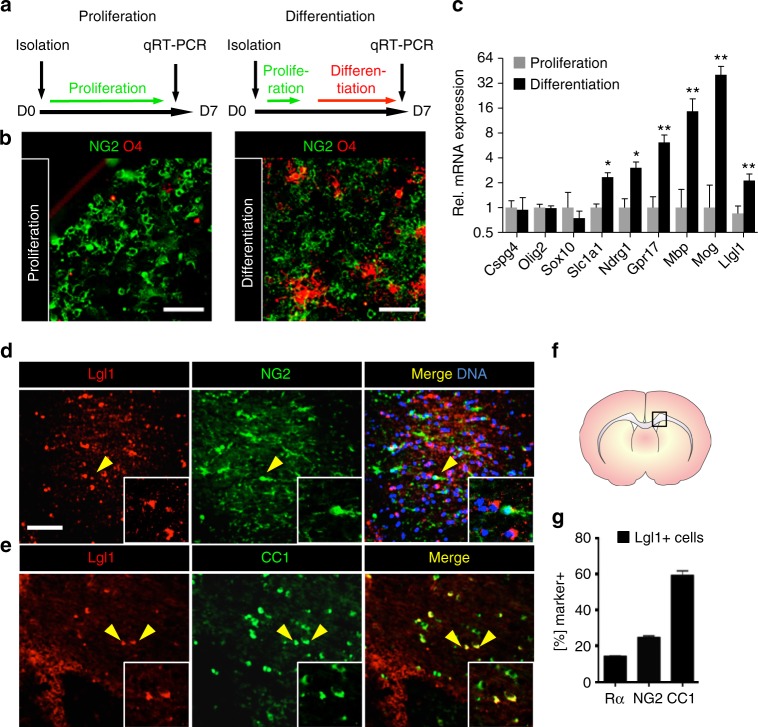
Lgl1 is expressed in oligodendrocyte progenitor cells (OPC) and its expression increases with differentiation into oligodendrocytes. a Scheme of OPC treatment before qRT-PCR. b Immunofluorescence for OPC marker NG2 and oligodendrocyte differentiation marker O4 of corpus callosum-derived OPC under proliferating or differentiating conditions. Differentiation increases O4-positive cell frequency. Scale bar = 100 µm. c Graph representing mRNA expression level changes with differentiation. qRT-PCR results are displayed on a log2 scale and normalized to proliferative conditions. Data represented as mean ± s.e.m. of five independent experiments (n = 5, *p < 0.05, **p < 0.01, Mann–Whitney test). d, e Co-immunostaining of P35 wildtype mouse corpus callosum for Lgl1 and OPC marker NG2 (top panels) or differentiation marker CC1 (bottom panels). Insets are high magnification panels of Lgl1 positive cells (yellow arrows). Scale bar: 100 μm. f Schematic of coronal section of a P60 mouse showing the corpus callosum where cells were counted. g Quantification of PDGFRα-positive, NG2-positive, and CC1-positive cells per total Lgl1-positive cells. 14% were PDGFRα-positive, 22% were NG2-positive, and 59% were CC1-positive. Data are represented as mean ± s.e.m. of four independent experiments

