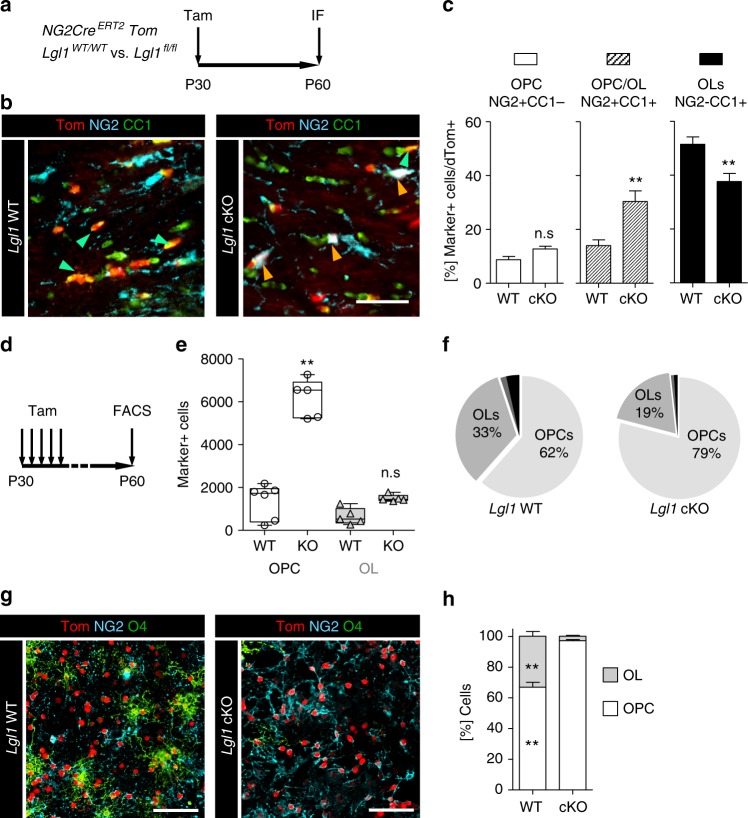
Fig. 2.
Lgl1 knockout blocks OPC to OL differentiation. a Schematic of approach for clonal labeling and NG2 Cre-conditional deletion of Lgl1 in OPC. b Representative triple immunostaining of corpus callosum of Lgl1 WT and Lgl1 cKO from mice treated as in (a) for red fluorescent protein (Tom), OPC marker NG2 and differentiation marker CC1. Green arrows point to Tom+CC1+ oligodendrocytes. Orange arrows in the Lgl1 cKO panel point to Tom+NG2+CC1+ cells. Scale bar: 50 µm. c Quantification of NG2+, CC1+, and NG2+CC1+ cells ratios amongst Tom+ cells. Data are represented as mean ± s.e.m. from the analyses of 4 Lgl1 WT vs. 4 Lgl1 cKO treated mice (**p < 0.01, Mann–Whitney test). d Schematic of broad deletion of Lgl1 in P30 mice followed by FACS at P60. e Plot showing quantification of OPC (white) and OL (gray) in mice treated following scheme in (d). Data are represented as box & whiskers ± s.e.m. from the analyses of 6 Lgl1 WT vs. 5 Lgl1 cKO treated mice (**p < 0.01, Mann–Whitney test). f Pie charts of quantification for NG2+, O4+, astrocyte marker GLAST+ and neuroblast marker CD24+ cells amongst Tom+ cells, after Lgl1 knockout at P60 (see also Supplementary Fig. 2b). Data are represented as percentages from the analyses of 6 Lgl1 WT vs. 5 Lgl1 cKO mice (OPC p < 0.01; OL p < 0.01). g Representative immunostaining for NG2 and O4 of OPC and OL isolated from GFAP-Cre, Tom, Lgl1wt/wt and, GFAP-CreERT2, Tom, Lgl1fl/fl mice. Scale bars: 100 µm. h Quantification of NG2 and O4 cells amongst all red fluorescent protein (Tom) positive cells show that Lgl1 knockout strongly blocks the differentiation of OPC into O4+OL. Data are represented as mean ± s.e.m. from the independent analyses of 4 Lgl1 WT vs. 4 Lgl1 cKO mice (**p < 0.01, Mann–Whitney test)

