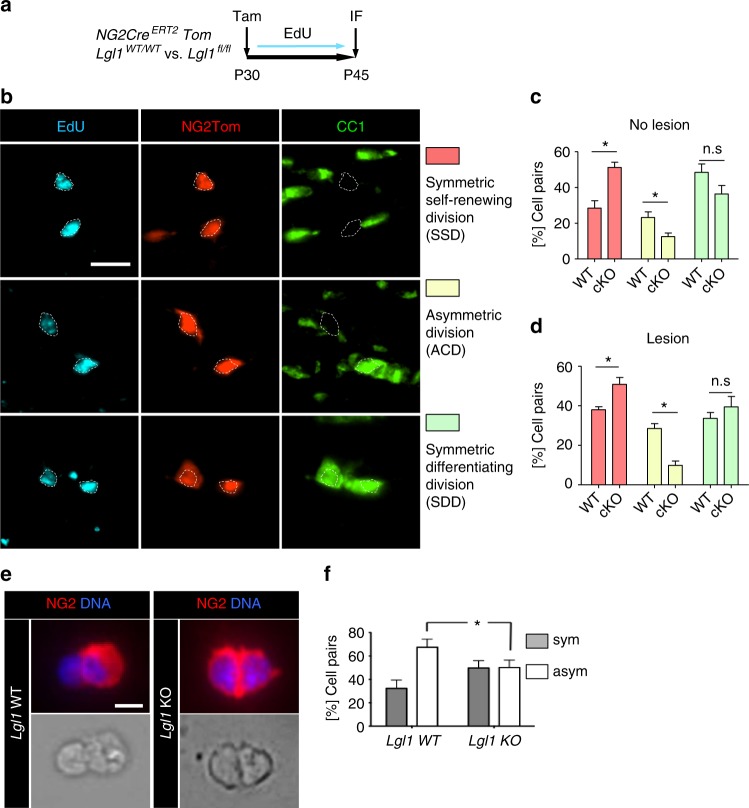
Fig. 3.
Lgl1 regulates asymmetric cell divisions of OPC. a Treatment schematic for in vivo pair assay in P30 NG2-CreERT2 Tom Lgl1 WT vs. Lgl1 cKO mice, which were given EdU for 14 days in drinking water. b Left panels: Representative cell pairs in the corpus callosum of treated mice and co-immunostained for red fluorescent protein (Tom) to label NG2+ cells and progeny, proliferation marker EdU and CC1. Symmetric, self-renewing divisions = two Tom+EdU+CC1− progeny, asymmetric cell division = one Tom+EdU+CC1− and one Tom+EdU+CC1+ progeny and symmetric, differentiating division = two Tom+EdU+CC1+ progeny. Scale bar: 10 µm. c Graph depicting the frequency of each cell division mode and showing a significant decrease of asymmetric divisions (yellow bars) and an increase of symmetric, self-renewing divisions (red bars) in Lgl1 knockout (cKO) mice when compared with wildtype (WT) mice. Data are represented as mean ± s.e.m. from the analyses of 4 Lgl1 WT vs. 4 Lgl1 cKO treated mice (n = 4, *p < 0.05, Mann–Whitney test). d Graph depicting the percentage of three division modes during remyelination in Lgl1 WT and Lgl1 cKO corpus callosum, and showing a significant decrease of asymmetric divisions (yellow bars) and increase of symmetric, self-renewing divisions (red bars). Data are represented as mean ± s.e.m. from the analyses of 4 Lgl1 WT vs. 4 Lgl1 cKO treated mice (n = 4, *p < 0.05, Mann–Whitney test). e Representative NG2+ OPC pairs stained for NG2 (red) and DNA (blue) showing an asymmetric division in Lgl1 WT (left panel) and symmetric, self-renewing division in Lgl1 cKO (right panel) cells. Scale bar = 10 μM. f Graph depicting percentage of cell pairs and showing that Lgl1 loss increases symmetric, self-renewing divisions at the expense of asymmetric divisions in vitro (n = 6, *p < 0.05, Mann–Whitney test)

