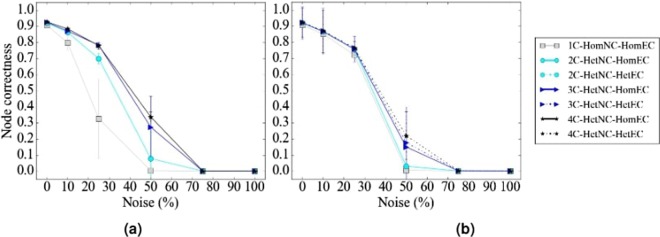
Figure 6.
Detailed alignment quality results regarding the effect of the number of node colors on alignment quality as a function of noise level for PPI, specifically APMS-Expr, networks using (a) WAVE and (b) SANA. The figure can be interpreted in the same way as Fig. 5. Recall that for these larger networks, we have not run MAGNA++ due to its high computational complexity. Equivalent results for the remaining PPI, specifically APMS-Seq, Y2H-Expr, and Y2H-Seq, networks are shown in Supplementary Figures S4, S5, and S6.

