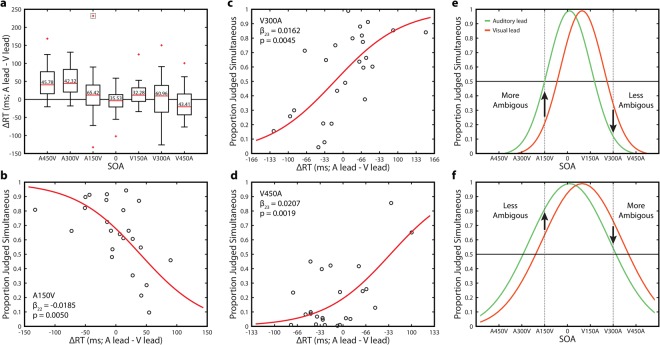
Figure 2.
Effects of Rapid Recalibration on Response Time are Individualized. (a) Change in response time (A lead RT – V lead RT) for all SOAs. Inset numbers are the standard deviation of the change in response time. The dotted box indicates an outlier value not shown in panel B. (b) Correlation between change in response time (A lead RT – V lead RT) and participant mean perception rate pooled across lead types for the A150V condition. A single outlier was omitted (see main text for statistics with the outlier included). (c) Correlation between change in response time (A lead RT – V lead RT) and participant mean perception rate pooled across lead types for the V300A condition. (d) Correlation between change in response time (A lead RT – V lead RT) and participant mean perception rate pooled across lead types for the V450A condition. (e) Illustration of the effect of lead type on perceptual ambiguity for a participant with a narrow binding window. Relative to a visual lead, auditory leading trials are more perceptually ambiguous in the A150V condition, but less ambiguous in the V300A condition. The PSS for each distribution is identical to panel F. (f) Illustration of the effect of lead type on perceptual ambiguity for a participant with a wide binding window. Relative to a visual lead, auditory leading trials are less perceptually ambiguous in the A150V condition, but more ambiguous in the V300A condition. The PSS for each distribution is identical to panel E.

