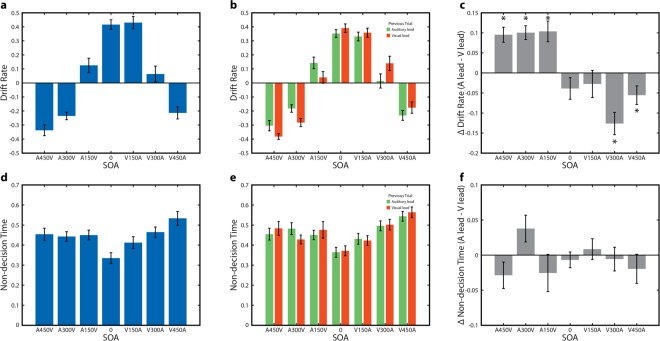
Figure 3.
Drift Diffusion Model Results. (a) Drift rate for each of the seven SOAs for a model pooled across auditory leading and visual leading trials. Error bars indicate standard error of the mean. (b) Drift rate for each of the seven SOAs for two models fit separately based on whether the previous trial was auditory leading or visual leading. Error bars indicate standard error of the mean. (c) Difference in drift rate (auditory lead – visual lead) between the two models in panel B. Error bars indicate standard error of the mean. (d) Non-decision time for each of the seven SOAs for a model pooled across auditory lead and visual lead trials. Error bars indicate standard error of the mean. (e) Non-decision time for each of the seven SOAs for two models fit separately based on whether the previous trial was auditory leading or visual leading. Error bars indicate standard error of the mean. (f) Difference in non-decision time (auditory lead – visual lead) between the two models in panel E. Error bars indicate standard error of the mean.

