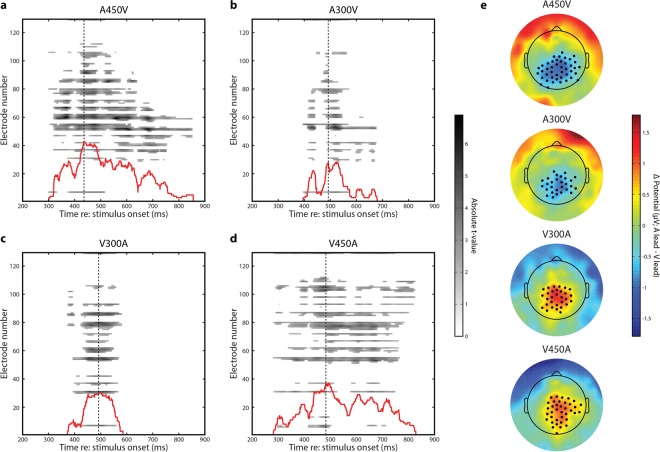
Figure 4.
Spatiotemporal Clustering Results. (a) Raster plot representation of the spatiotemporal cluster in the A450V condition. The absolute value of the t-statistic is indicated for each time point for comparisons which are both individually significant (p < 0.05) and part of the significant spatiotemporal cluster. The inset red line indicates the number of significant electrodes at each time point (same scale as electrode number). The dashed line indicates the time point when the cluster reached maximum spatial size for the first time. (b) Raster plot representation of the A300V condition. Inset lines as in panel A. (c) Raster plot representation of the V300A condition. Inset lines as in panel A. (d) Raster plot representation of the V450A condition. Inset lines as in panel A. (e) Topographic representation of voltage differences between auditory and visual leading trials (A lead – V lead) for each SOA. Black dots indicate electrodes which are both individually significant (p < 0.05) and part of the significant spatiotemporal cluster. Time points for each SOA correspond with the dashed line in panels A–D.

