Fig. 1.
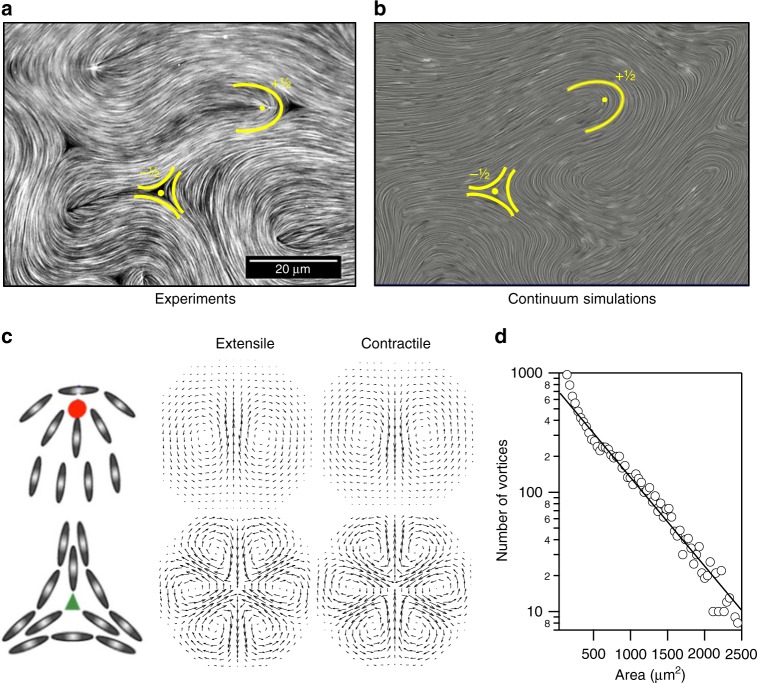
Active nematic turbulence. a Fluorescence confocal microscopy micrograph of the active nematic in contact with an oil of 0.05 Pa s (see Supplementary Movie 1 where positive defects are tracked). b Snapshot of the time evolution from solving the continuum equations of motion, showing active turbulence. A comet-like, +1/2, and a trefoil-like, −1/2 defect are highlighted in each case. c Particle alignment and velocity fields around ±1/2 topological defects in extensile and contractile active systems. d Experimental distribution of vortex sizes in an active nematic in the regime of active turbulence, adapted from data in ref. 15, Nature Publishing Group. The solid line is an exponential fit to the data

