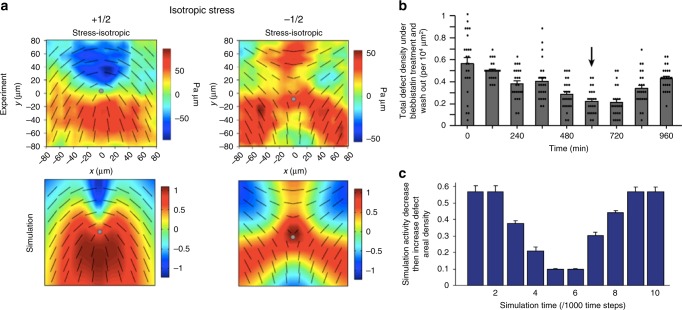
Fig. 5.
Stress patterns and density of topological defects. a Comparison of the isotropic stress around +1/2 (left) and −1/2 (right) topological defects between the experiments on monolayers of MDCK cells and continuum numerical simulations of active nematics. Colourmaps show the magnitude of the isotropic stress with blue (red) corresponding to mechanical compression (tension). b, c Total defect areal density evolution as a function of time. In the experiments (b) blebbistatin was introduced at t = 0 to suppress the cell motility and was washed out at the time 600 min (shown by an arrow). Similarly in the simulation (c) the activity parameter decreased at simulation time t = 0, then increased at t = 532. (Nature Publishing Group)

