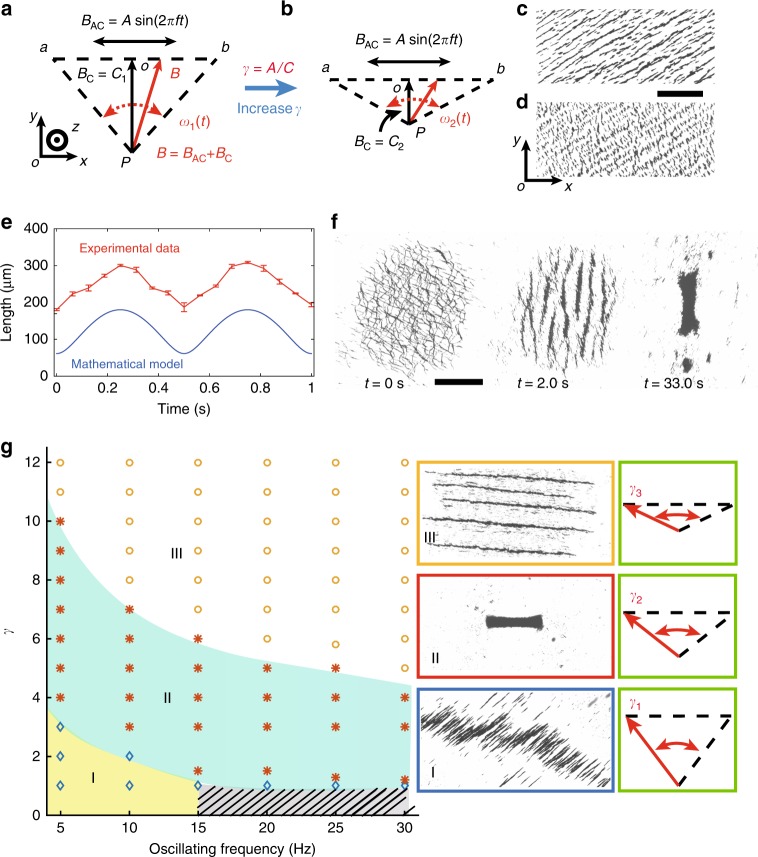
Fig. 1.
Actuation of ribbon-like magnetic microswarm using oscillating magnetic fields. a A schematic depiction illustrates the applied oscillating magnetic field. The red arrow shows the magnetic field, which is the superposition of BC and BAC. The angular velocity of the field is represented by ω(t). The amplitude ratio is γ = A/C, and A is 10 mT in this paper. b A schematic depiction illustrates the oscillating magnetic field when the amplitude ratio is increased. c The particle chain formed when the field points a or b, in which case the field strength is the largest. The scale bar is 400 μm. d The particle chain formed when the field points O, in which case the field strength is the weakest. In c and d the applied oscillating frequency is 3 Hz. e The relationship between the length of the particle chains and time, actuated by the oscillating magnetic field. Each data point represents the average of 3 experiments. The error bar indicates the standard deviation (s.d.). f The generation process of an RPNS (Supplementary Movie 1). The scale bar is 800 μm. g The phase diagram showing the swarm patterns actuated by different input magnetic fields. The oscillating fields that trigger different swarm patterns are schematically presented in the green rectangles. In the grey shadowed region, no regular patterns can be formed

