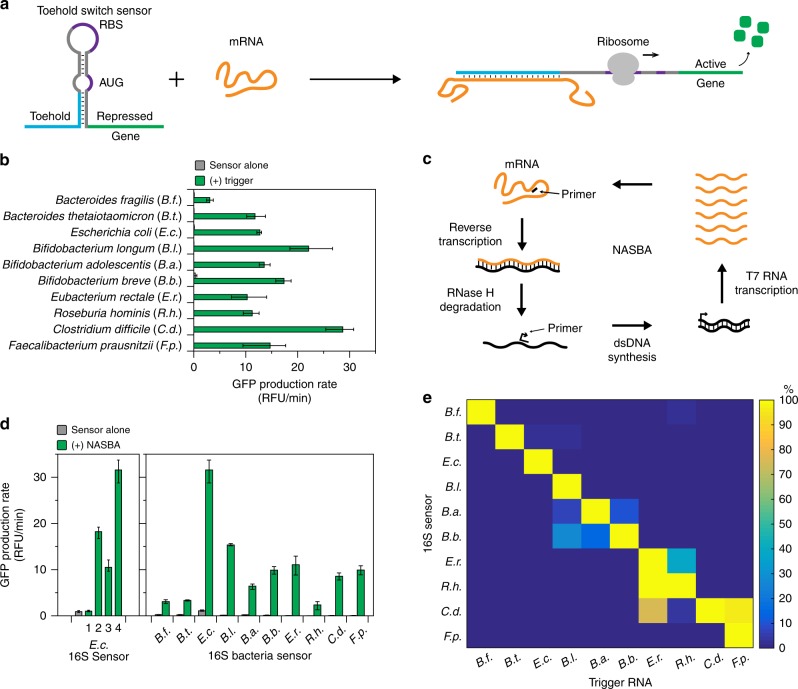
Fig. 2.
16S rRNA sensors. a Schematic of toehold switch sensor function. b Best performing toehold switch sensors targeting the V3 hypervariable region of 16S rRNA for each species. Data represent mean GFP production rates from paper-based reactions with sensor alone and sensor plus 36-nucleotide trigger RNA (2 μM). Error bars represent high and low values from three technical replicates. c Schematic of NASBA-mediated RNA amplification. d Evaluation of NASBA primers. NASBA reactions were performed on 1 ng of total RNA for 90 min. Outputs from NASBA reactions were used to activate toehold switch sensors in paper-based reactions. Data represent mean values of three technical replicates. Error bars represent high and low values of the three replicates. e Orthogonality of 16S sensors. Each sensor was challenged with 2 μM of NASBA trigger RNAs from each species representing what would be amplified in a NASBA reaction. GFP production rates for an individual sensor were normalized to the production rate of the sensor plus its cognate trigger (100%). Data represent mean values of six replicates (two biological replicates × three technical replicates). Full data and s.d. are shown in Supplementary Figure 3

