Fig. 3.
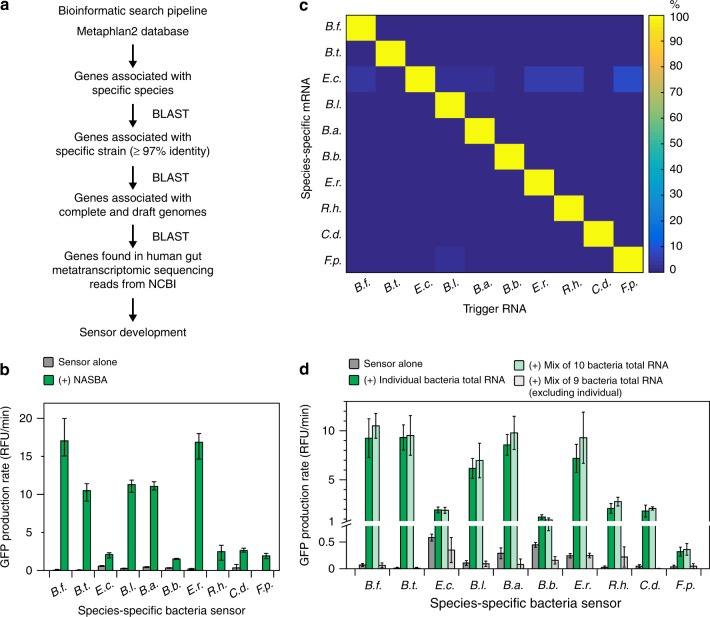
Species-specific mRNA sensors. a Bioinformatic pipeline for identifying species-specific mRNAs. b Best performing NASBA primers and species-specific mRNA sensors for each species. NASBA reactions were performed on 10 ng of total RNA for 90 min. Outputs from NASBA reactions were used to activate toehold switch sensors in paper-based reactions. Data represent mean values of three technical replicates. Error bars represent high and low values of the three replicates. c Orthogonality of species-specific sensors. Each sensor was challenged with 2 μM of trigger RNAs from each species representing what would be amplified in a NASBA reaction. GFP production rates for an individual sensor were normalized to the production rate of the sensor plus its cognate trigger (100%). Data represent mean values of six replicates (two biological replicates × three technical replicates). Full data and s.d. are shown in Supplementary Figure 6. d Orthogonality of NASBA primer sets. NASBA reactions were performed on 10 ng of total RNA for 90 min. Data represent mean ± s.d. of six replicates (two biological replicates (NASBA reactions) × three technical replicates (paper-based reactions))

