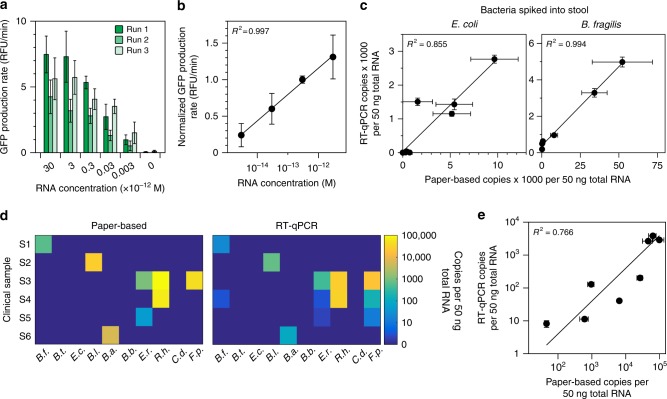
Fig. 4.
Quantification of NASBA-mediated amplification using toehold switch sensors. a Run-to-run variation in mRNA standards amplified by NASBA and measured by toehold sensors. mRNA standards for the B. thetaiotaomicron species-specific sensor were run in NASBA reactions for 30 min. Outputs from NASBA reactions were used to activate toehold switch sensors in paper-based reactions. b Calibration curve for the B.t. species-specific mRNA. Values from each standard in the individual runs in a were normalized to the 300 fM standard for that specific run and averaged across runs. c Quantifying species-specific mRNAs in stool. E. coli or B. fragilis cells were spiked into 150 mg of a commercial stool sample and processed for total RNA. Species-specific mRNAs were quantified using our paper-based platform and RT-qPCR. d Analysis of clinical stool samples. Six clinical stool samples were processed for total RNA and analyzed by our paper-based platform and RT-qPCR. Data and s.d. are shown in Supplementary Figure 11. e Correlation of clinical sample results. Non-zero paper-based concentrations from d were compared to RT-qPCR determined values. Data represent mean values. Paper-based error bars in a, c, and e represent s.d. from nine replicates (three biological replicates (NASBA reactions) × three technical replicates (paper-based reactions)). RT-qPCR error bars in c and e represent s.d. from six replicates (two biological replicates (RT reactions) × three technical replicates (qPCR reactions))

