
Figure 1.
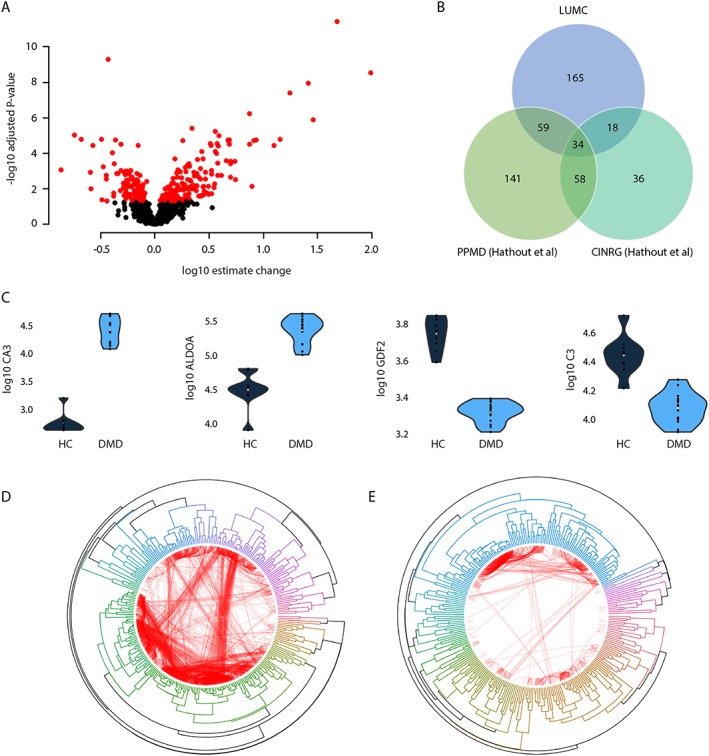
Cross‐sectional analysis of DMD patients. (A) Volcano plot showing the estimated change in DMD patients compared with healthy controls (x‐axis) and the −log10 of the adjusted P‐values. Black circles represent proteins that are not differentially represented in patients compared to healthy controls, while red circles represent the 285 proteins surviving multiple testing correction. (B) Overlap with known proteins able to discriminate between DMD and healthy controls identified using SOMAmers. (C) Violin plots showing four examples of proteins differentially represented between DMD patients and healthy controls. Carbonic anhydrase 3 (CA3) and fructose‐bisphosphate aldolase A (ALDOA) were elevated in patients over controls, while growth differentiation factor 2 (GDF2) and complement component 3 (C3) levels were reduced in DMD patients compared with healthy controls (adjusted P < 0.01 for all). (D–E) Circular plots showing correlation‐based hierarchical clustering of the 285 differentially expressed proteins in healthy individuals (D) and DMD patients (E). Connections shown in red represent correlations between protein levels in each group. Only correlations above 0.8 are shown. The thickness of the lines is proportional to the correlation strength.