
Figure 2.
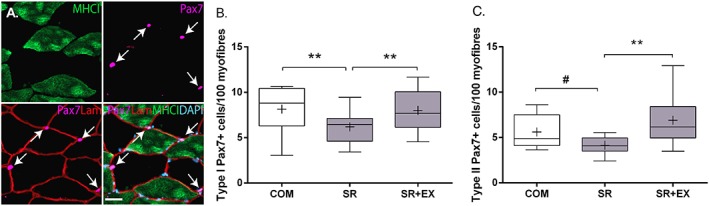
Representative images (A) of single channel stains for myosin heavy chain (MHC)1, and Pax7 and merged stain of Pax7/laminin (LAM) and Pax7/LAM/MHCI/DAPI of a muscle cross section. Scale bar = 50 μm. Quantification of the number of satellite cells (Pax7+ myonuclei/fibre) in type I (B) and type II (C) muscle fibres during step reduction (SR; N = 14), step reduction with low‐load resistance exercise (SR + EX; N = 14), and in healthy ambulatory comparators (COM; N = 7). Data presented as mean (‘+’), median (line), interquartile range (box), and minimum and maximum (whiskers). **Significantly different, P < 0.01. #Trend for a difference, P = 0.027.