
Figure 4.
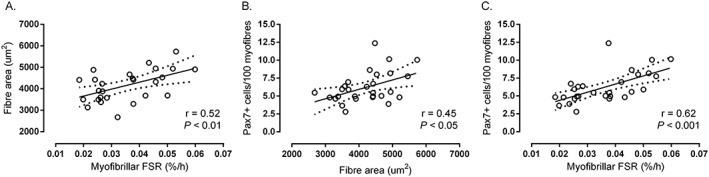
Correlation between average fibre cross‐sectional area and fasted myofibrillar protein synthesis rates (A), average PAX7+ cells/100 fibres and average fibre cross‐sectional area (B), and average PAX7+ cells/100 fibres and fasted myofibrillar protein synthesis (C) collapsed across step reduction and step reduction with low‐load resistance exercise (N = 28 for all correlations). Fasted myofibrillar protein synthesis determined previously.10