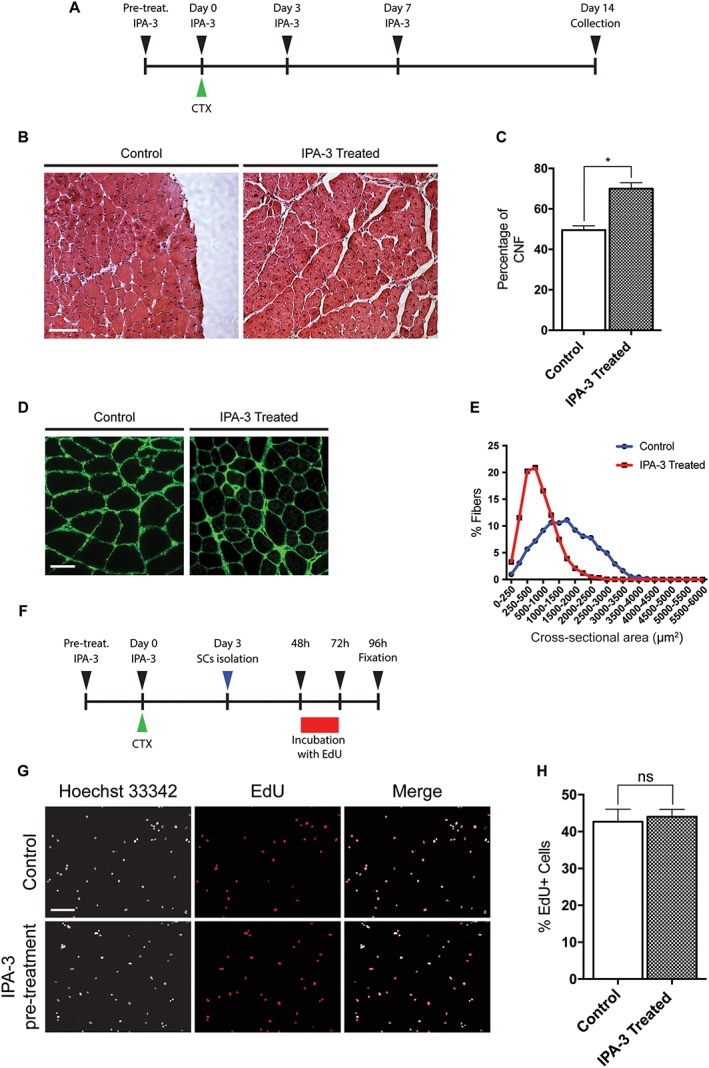
Figure 3.

IPA‐3 in vivo treatment delays muscle regeneration. (A) Graphical representation of the IPA‐3 treatments prior and following CTX treatment. (B) Representative images of haematoxylin and eosin histological staining on mouse TA sections 14 days after CTX injection. Scale bar: 100 μm. (C) The bar graph shows the percentage of CNF 14 days after CTX injury in the TA of control and IPA‐3 treated mice (n = 2, unpaired t‐test, *P ≤ 0.05). (D) Immunofluorescence images showing laminin expression in mouse TA sections 14 days after CTX injection. Scale bar: 50 μm. (E) Graphical representation of CSA distribution in TA of IPA‐3 treated and control mice 14 days after CTX injury. The values represent the mean of two muscle samples (n = 2). (F) Schematic representation of the EdU labelling of SC following in vivo IPA‐3 pre‐treatment and CTX injury. (G) Immunofluorescence microphotographs of SCs 24 h upon EdU pulse (green). Scale bar: 100 μm. (H) Bar plot showing the percentage of EdU positive SCs for the experiment reported in G (n = 3, unpaired t‐test). SEM is indicated in all figures. CTX, cardiotoxin; CNF, centrally nucleated fiber; TA, tibialis anterior.
