
Figure 7.
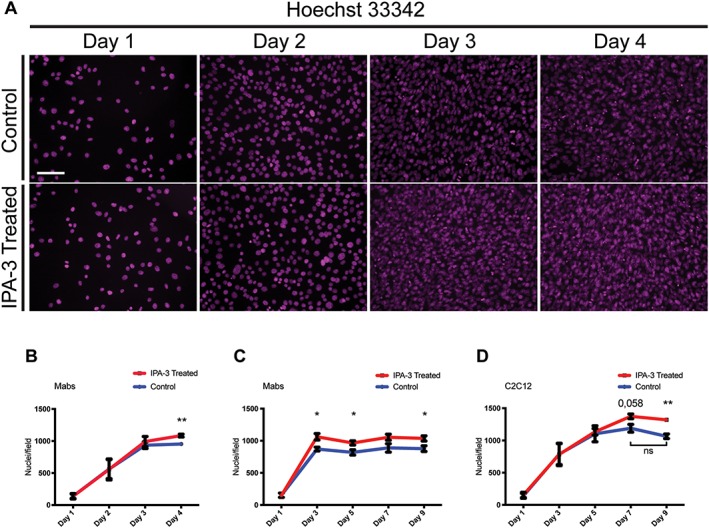
IPA‐3 treatment delays Mabs cell cycle exit without affecting proliferation rate. (A) The panels show Mabs nuclei stained with Hoechst 33342 (magenta) at four time points after plating in growth medium supplemented with DMSO (control) or with IPA‐3. (B) The graph illustrates the number of Mabs nuclei/field during the first 4 days of differentiation. (C, D) The graphs show the number of nuclei/field during 9 days of differentiation for Mabs and C2C12, respectively. Field area is approx. 2,84 * 105 μm2. The values are mean of at least three independent experiments + SEM. Statistical significance has been evaluated using the unpaired t‐test, *P ≤ 0.05, **P ≤ 0.01. Scale bar: 100 μm. Mabs, mesoangioblasts.