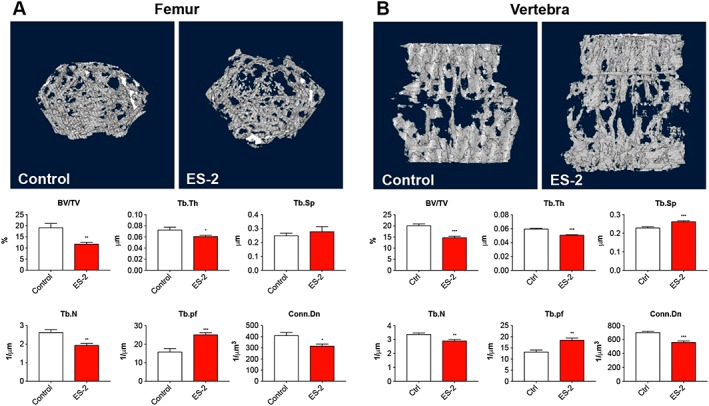
Figure 6.

Growth of the ES‐2 tumour affects bone quality. Representative three‐dimensional rendering of microcomputed tomography scan images and quantification of bone volume fraction (BV/TV), trabecular thickness (Tb.Th), trabecular separation (Tb.Sp), trabecular number (Tb.N), and trabecular connectivity density (Conn.Dn) in the femurs (A) and vertebrae (B) of mice bearing the ES‐2 tumour (n = 6–10). Data are expressed as means ± standard deviation. Significance of the differences: * P < 0.05, ** P < 0.01, *** P < 0.001 vs. Control.
