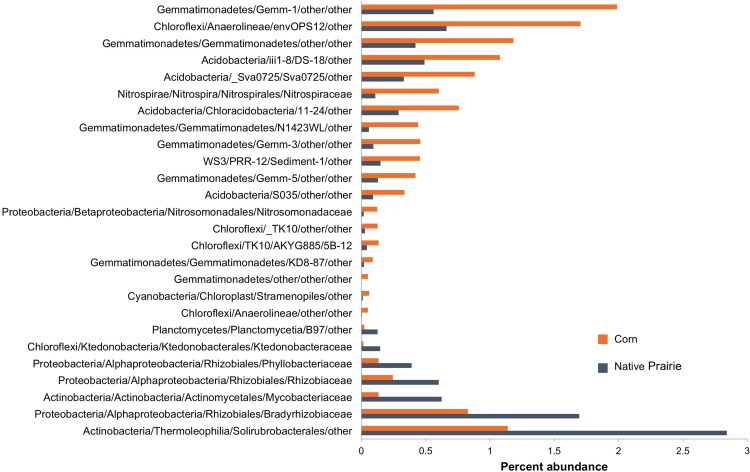
FIGURE 2.
Abundance of bacterial families that differentiate corn and native prairie samples. Key OTUs at the family level that are significantly different between corn and native prairie samples, regardless of state (Kansas, Wisconsin, and Iowa). The non-parametric Mann–Whitney t-test (number of permutations = 999) was used to compare relative abundance of families in corn and native prairie samples from a single-rarified OTU table at 3,266 sequences/sample. Families with Bonferroni corrected P-values <0.05 were chosen for visualization.

