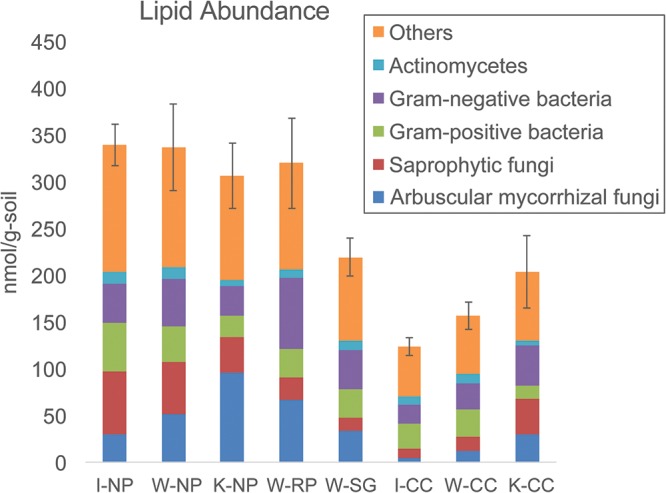
FIGURE 3.

Total lipid abundance (microbial biomass nmol/g) and distribution patterns (%) of the main microbial groups. “Others” indicates microbial groups where taxonomic origin cannot be determined. Samples are (from left to right): Wisconsin native prairie, Kansas native prairie, Wisconsin restored prairie, Wisconsin switchgrass, Iowa cultivated corn, Wisconsin cultivated corn, and Kansas cultivated corn. Bar graphs show total lipid abundance and the relative abundance of each group. Error bars are the standard error of the total lipid abundance.
