FIGURE 2.
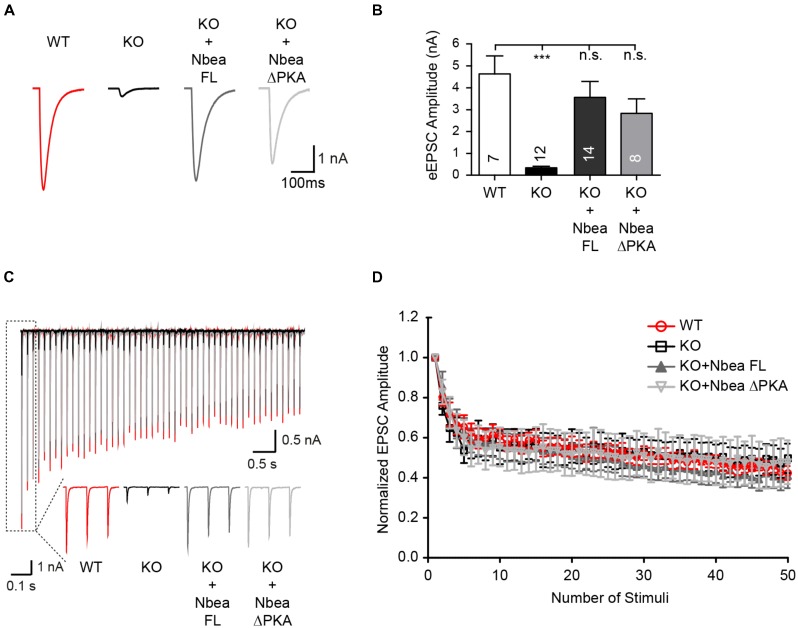
Evoked EPSCs at autaptic synapses are restored by full-length Nbea and NbeaΔPKA. (A) Sample traces of evoked EPSCs recorded from individual hippocampal neurons grown on micro islands that form autapses. The eEPSCs shown are from untransfected WT, from Nbea KO neurons mock transfected with GFP alone, and transfected with Nbea FL or NbeaΔPKA constructs. (B) Average values of eEPSC amplitudes from WT, KO/GFP, Nbea FL, and NbeaΔPKA. Data are means ± SEM; ∗∗∗P < 0.001, n.s., not significant; by one-way ANOVA with Tukey’s multiple comparisons test. (C) Overlay of representative traces of eEPSCs during AP stimulation trains (10 Hz) from WT, KO/GFP, KO + Nbea FL and KO + NbeaΔPKA; insets depict magnifications of the response to the first three stimuli. (D) Change in EPSC amplitudes during a 10 Hz stimulation train in WT, KO, KO + Nbea FL and KO + NbeaΔPKA autaptic glutamatergic neurons. NWT = 5 neurons, NKO = 7 neurons, NKO+NbeaFL = 11 neurons, NKO+NbeaΔPKA = 6 neurons.

