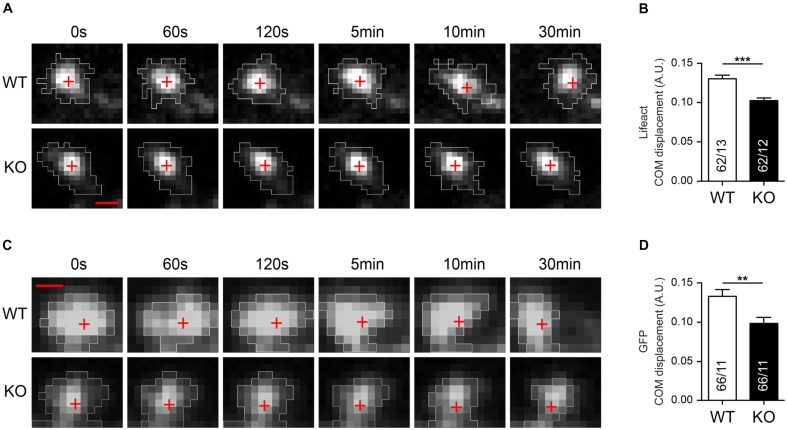
FIGURE 7.
Impaired basal motility of Nbea-deficient DSs. (A) Representative image frames of WT and Nbea KO spines at different time points and transfected with Lifeact fused to RFP. The fluorescent signal of Lifeact-RFP highlights specifically polymerized filamentous F-Actin. White areas represent regions taken in consideration for center of mass (COM) displacement analysis in each time point. Red crosses depict the position of COM at each time point. (B) Quantification of COM displacement in WT and Nbea KO single spine. Data are means ± SEM, N, number of spines/neurons (in bars); ∗∗∗P < 0.001 by unpaired t-test. (C,D) Similar analysis to (A,B) using an alternative label of the spine volume, cytosolic GFP expressed in WT and Nbea KO neurons. White areas represent regions taken in consideration for COM displacement analysis in each time point. Red crosses depict the position of COM at each time point. Data are means ± SEM, N, number of spines/neurons (in bars); ∗∗P < 0.01 by unpaired t-test. Scale bar: 1 μm; pixel size = 0.211 μm.

