FIGURE 8.
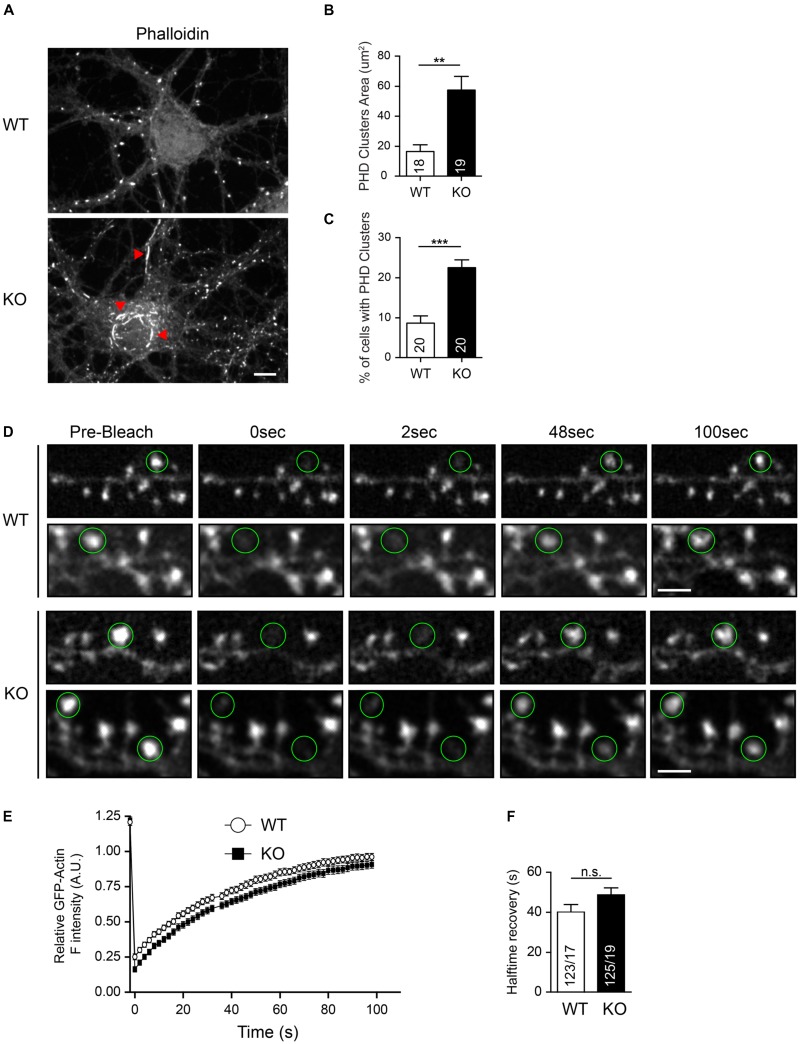
Normal actin polymerization and turnover in Nbea-deficient DSs. (A) Representative images of hippocampal WT and Nbea KO neurons stained with fluorescent phalloidin. Red arrowheads in images point to ectopic actin clusters mostly in the soma and soma-near large dendrites. Scale bar: 5 μm. (B) Quantification of actin cluster areas detected by phalloidin staining. Data are means ± SEM, N, number of neurons (in bars); ∗∗∗P < 0.001 by unpaired t-test. (C) Quantification of the percentage of cells with visible phalloidin-stained actin clusters in WT and KO cultures. Data are means ± SEM, N, number of visual fields counted (in bars); ∗∗∗P < 0.001 by unpaired t-test. (D) Representative images of FRAP experiments of wild-type (WT) and Nbea-deficient (KO) spines at different time points. Samples show GFP-actin transfected dendrites at the indicated time points after bleaching, pre-Bleach indicates spines before quenching. Green circles, region selected for bleaching around spine heads. Scale bar: 2.5 μm. (E,F) Quantification of FRAP data with first order exponential equation fitting of relative fluorescence intensity of GFP-Actin values over time (E). Halftime recovery of GFP-Actin was derived from exponential curves (F). Data are means ± SEM, N, number of spines/neurons (in bars); n.s., not significant by unpaired t-test.

