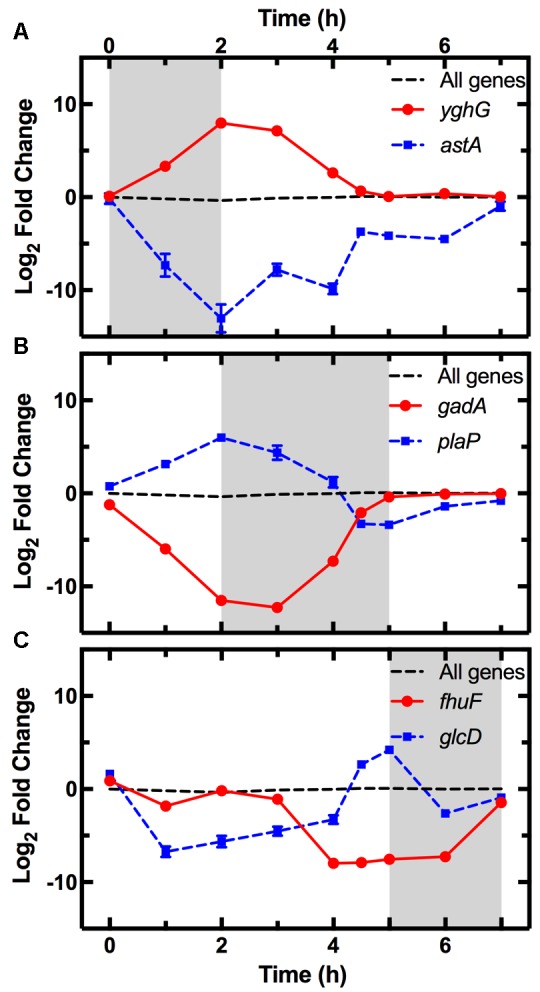
FIGURE 4.

Pattern of expression of the top most upregulated and downregulated genes during each phase. Expression profiles of the most upregulated (circles) and downregulated (squares) genes between t = 0–2 h (A), t = 2–5 h (B), and t = 5–7 h (C) from dilution in LB medium of an overnight E. coli culture. Gene expression is reported as the log2 fold change with respect to the measurements on the overnight samples (t = 17 h). The average expression dynamics for the whole transcriptome (dashed line) remains relatively constant throughout the different phases of growth. The expression dynamics for all the 4373 analyzed genes is reported in Supplementary Table S1. Data and error bars are the mean and SEM of measurements obtained on biological triplicates. Error bars are hidden behind some of the data points.
