Figure 1.
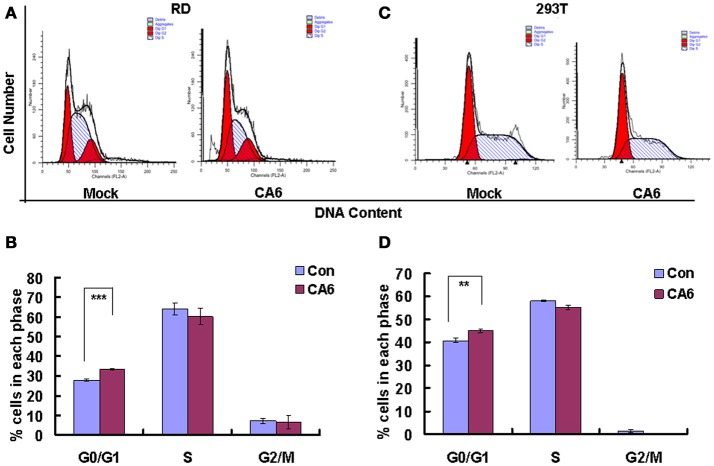
CVA6 infection induces G0/G1-phase accumulation. (A) At 24 h post-infection, RD cells infected with mock (Mock) or with CVA6 (CVA6) at an MOI of 1 were collected for analyzing cell-cycle profiles by flow cytometry. (B) The histograms were analyzed by the ModFit LT program to display the cell cycle distribution. ***P < 0.001. (C) At 48 h post-infection, 293T cells infected with mock (Mock) or with CVA6 (CVA6) at an MOI of 5 were collected for analyzing cell-cycle profiles by flow cytometry. (D) The histograms indicating cell cycle distribution were analyzed by the ModFit LT program. **P < 0.01. The results indicate the mean ± SD of three independent experiments.

