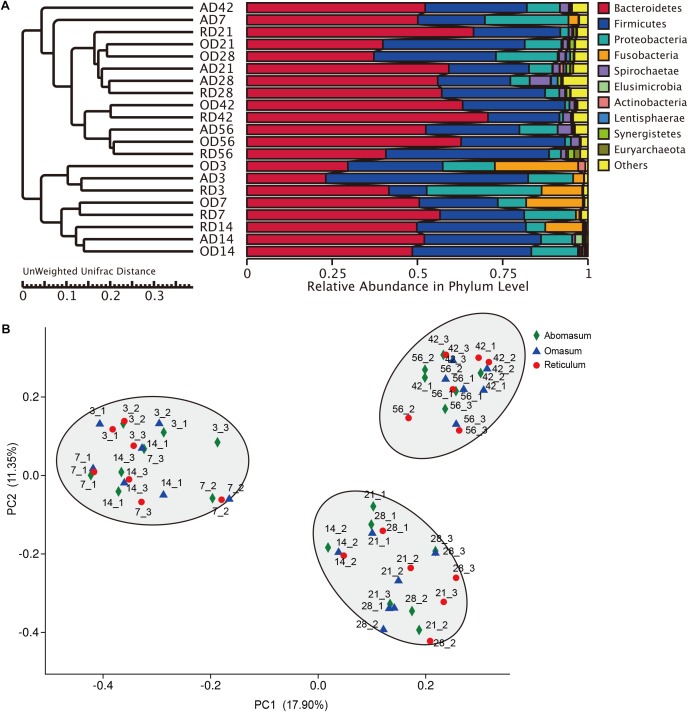
FIGURE 1.
Distribution of bacterial composition in goat compound stomachs. (A) UPGMA (Unweighted Pair-group Method with Arithmetic Mean) analysis of the similarities between different samples, and cluster analysis was used to construct the clustering tree of samples. the UPGMA cluster tree based on the Unweighted Unifrac distance. (B) Principal coordinate analysis (PCoA) profile of microbial diversity across all samples using an unweighted UniFrac metric, the percentage of variation explained by PC1 and PC2 are indicated in the axis.

