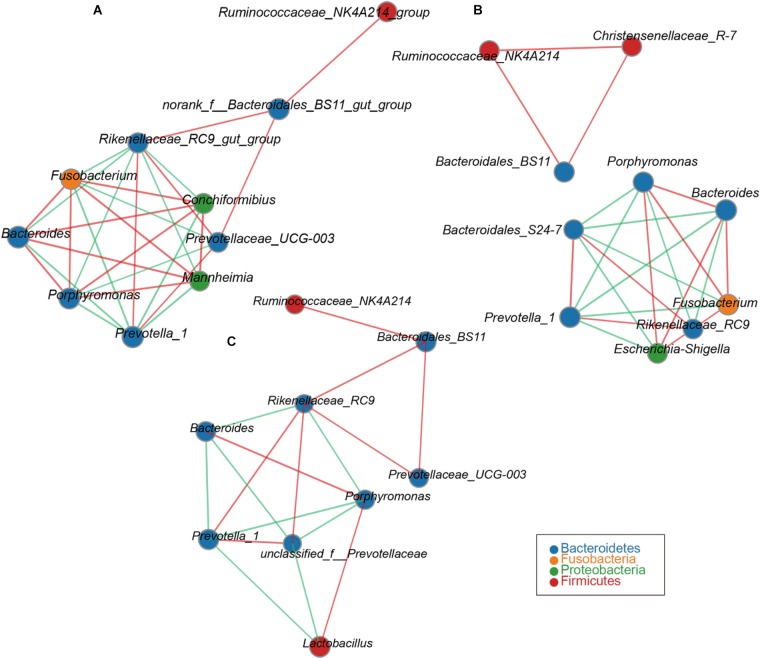
FIGURE 2.
Network analysis applied to the goat compound stomach. Reticulum (A), omasum (B), abomasum (C) microbiota at different ages. Genus correlation network maps mainly reflect the genus-relatedness of each taxonomic level under an environmental condition. By calculating the correlation coefficient between genera to reflect the correlation between genera. The size of the node is proportional to the abundance of the genera. Node color corresponds to phylum taxonomic classification. Edge color represents positive (green) and negative (red) correlations, and the edge thickness is equivalent to the correlation values.

