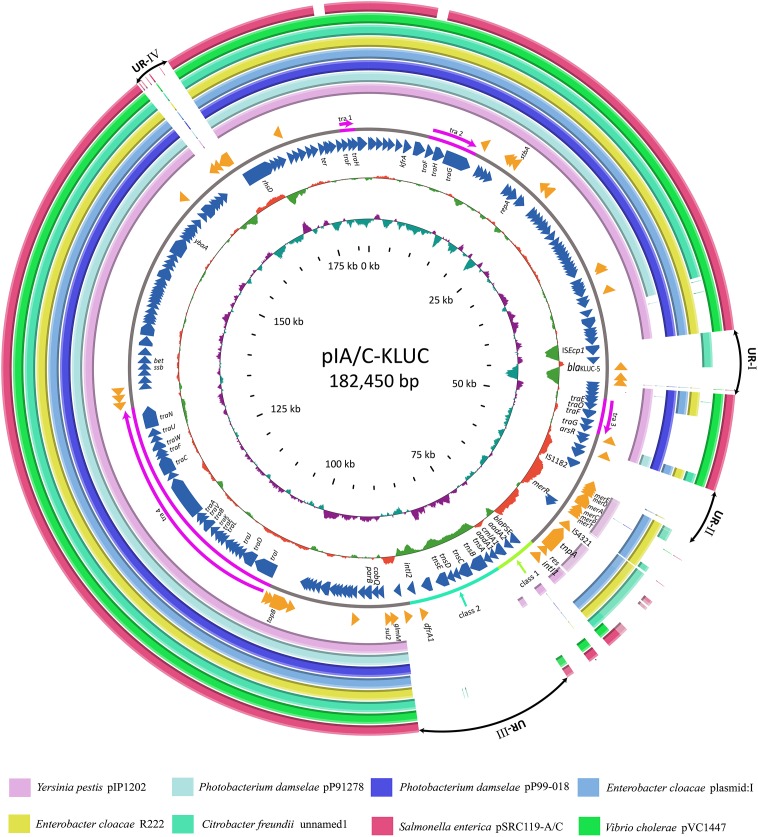
FIGURE 2.
Comparative genome analyses of several IncA/C group plasmids. Structural comparison of pIA/C-KLUC with those of the most similar IncA/C group plasmids. Circles 1-8 (from outside to inside) are homologous regions of pSRC119-A/C (Accession Number KM670336), pVC1447 (KM083064), unnamed1 (CP017058), R22 (KX8697741), plasmid: 1 (LT882699), pP99-018 (AB277723), pP91278 (AB277724), and pIP1202 (CP000603) compared to pIA/C-KLUC, whereas unmatched regions are left blank. Circles 9 and 11 represent the genes encoded by the forward and reverse strands of pIA/C-KLUC. Circles 12–13 are GC content and GC skew maps of pIA/C-KLUC. The four transfer regions of the plasmid (Tra1-4) are marked in pink in circle 10 and further indicated by arrows. UR-I, II, III, and IV are four large unique regions in pIA/C-KLUC compared with the other plasmids. Classes 1 and 2 represent classes 1 and 2 integrons.

