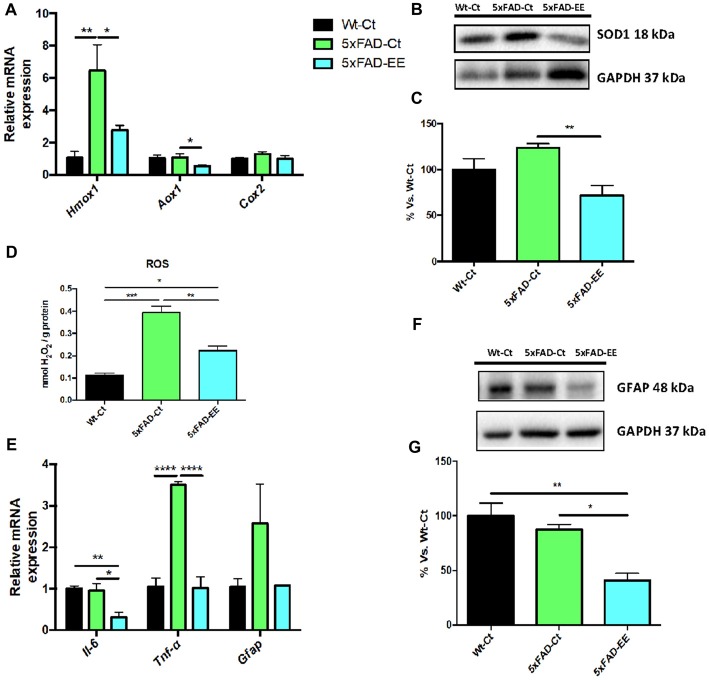
Figure 6.
Representative gene expression of antioxidant enzymes for Hmox1, Aox1, Cox2 (A). Representative Western blot for SOD1 protein levels (B) and quantification (C). Representative Oxidative stress measured as hydrogen peroxide concentration in homogenates of hippocampus tissue (D). Proinflammatory markers Il-6, Tnf-α and Gfap gene expression (E). GFAP protein levels (F) and quantification (G). Mean ± Standard error of the mean (SEM) from five independent experiments performed in duplicate are represented; *p < 0.05; **p < 0.01; ***p < 0.001; ****p < 0.0001.

