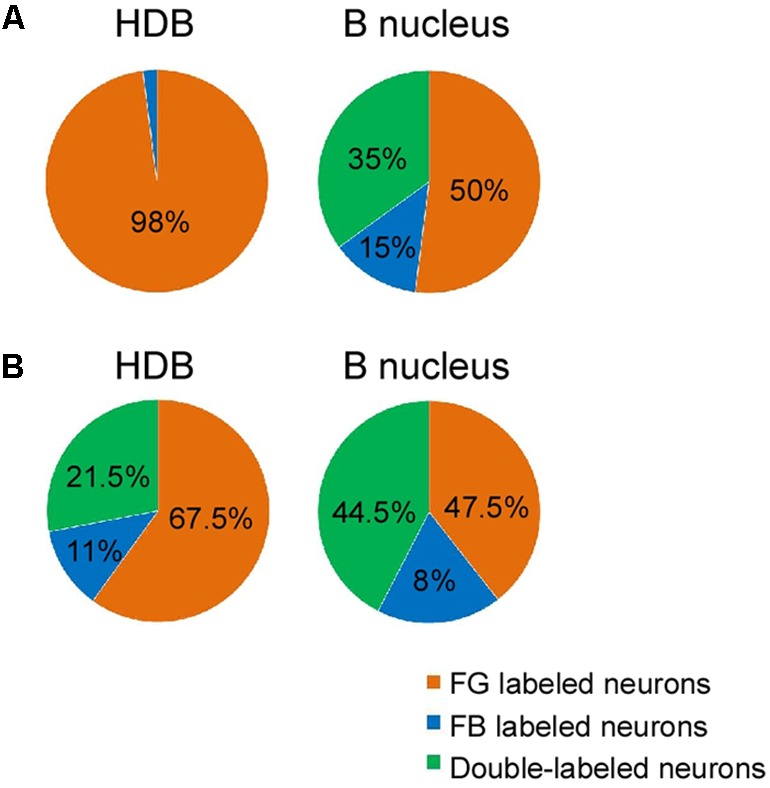
FIGURE 4.

Percentages of single, and double-labeled neurons according to the location of the injection/deposit sites. (A) Graphic representation of normalized relative percentages of FG and FB single neurons, and double-labeled neurons found in HDB and B nucleus after injections in S1/A1 cortices. Note that HDB mainly projects to S1 while the B nucleus projects to both S1 and A1 sensory cortices displaying numerous double-labeled neurons. (B) Graphic representation of FG and FB single neurons, and double-labeled neurons found in HDB and B nucleus after injections in S1/V1 cortices. B nucleus contained a large proportion of double-labeled neurons, indicating a lower specificity in their cortical projections.
