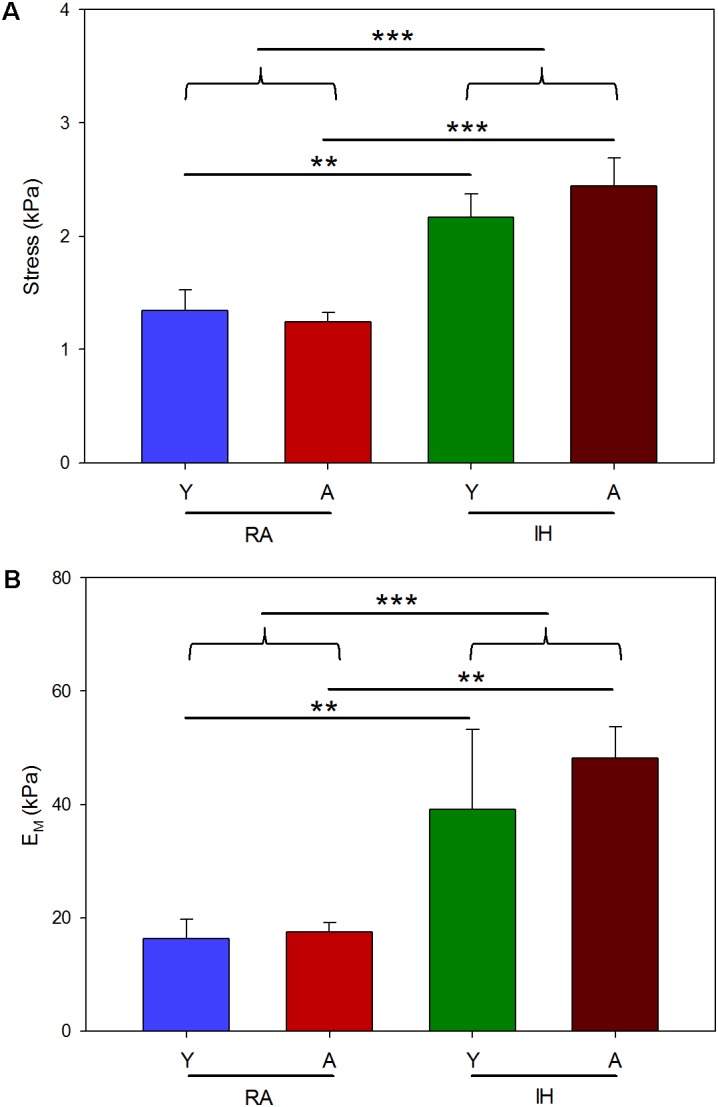
FIGURE 2.

Macroscale stiffness of LV myocardium ECM computed from the stress–strain relationship curves. Stress (A) and macroscale Young’s modulus (EM) (B) computed at 20% strain from young (Y) and aged (A) mice subjected to room air (RA) and IH mimicking OSA. Data are mean ± SE. ∗, ∗∗, ∗∗∗ denote p values less than 0.05, 0.01 and 0.001, respectively.
