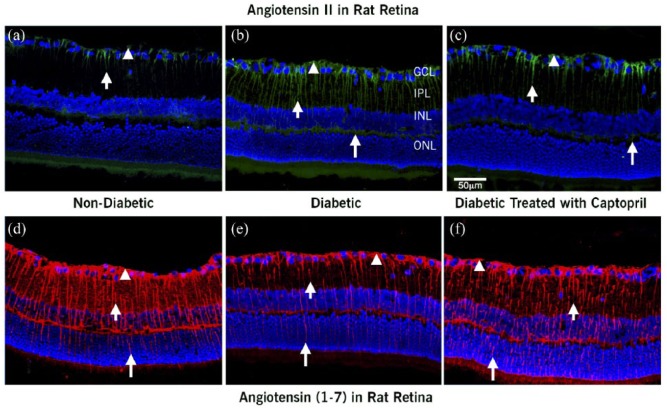
Figure 4.
Confocal images of localization of Ang II and Ang-(I-7) and nuclei merge in retina from (a and d) control nondiabetic rats, (b and e) diabetic rats, and (c and f) diabetic rats treated with captopril. Ang II and Ang-(1-7) were localized in Müller cells (arrowhead) of nondiabetic, diabetic, and captopril-treated rats as well. Ang II was localized to the Müller cell footplates and the Müller cell processes (short and long arrows). In diabetic rats (b), the intensity of labeling was higher than in the nondiabetic controls (a); while ACEI captopril decreased the level of Ang II staining compared with diabetic, it was no different than the level of staining of Ang II (c) compared with controls. In the nondiabetic retina, Ang-(I-7) extended from the footplates of the Müller cell (arrowhead) through cell processes extending up to the photoreceptor layer (d, long arrow). The extent and intensity of Ang-(1-7) labeling was significantly reduced in the diabetic retina (e). Treatment of diabetic rats with ACEI restored the intensity and extent of Ang-(1-7) labeling toward levels found in control nondiabetic animals (f).
Scale bar = 50 µm.

