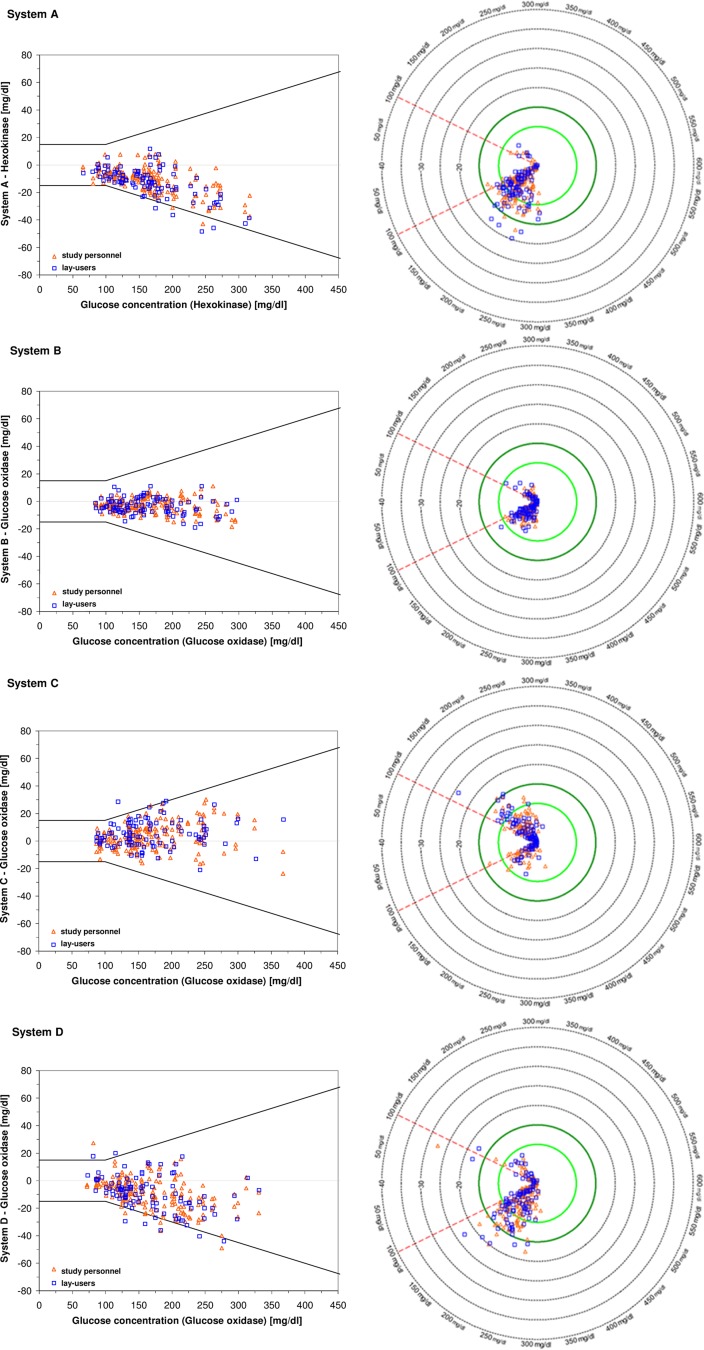
Fig. 1.
Difference plots (left side) and radar plots (right side) for the tested lot of each of the four SMBG systems when evaluated against the respective manufacturer’s comparison method (hexokinase for system A, glucose oxidase for system B, C, D). Measurements performed by lay-users (n = 100) are displayed in blue squares, measurements performed by study personnel (n = 200) are displayed in orange triangles. Difference plots: ISO 15197:2013 accuracy limits (± 15 mg/dl for BG concentrations < 100 mg/dl and ± 15% for BG concentrations ≥ 100 mg/dl) are displayed in solid lines. Radar plots: Data points show differences between SMBG measurement results and the respective comparison measurement result, absolute differences for BG concentrations < 100 mg/dl and relative differences for BG concentrations ≥ 100 mg/dl. The absolute values of the differences define the location of the data points, i.e., the distance from the center of the plot, and the sign of the differences indicates the hemisphere (positive sign, upper hemisphere; negative sign, lower hemisphere). The direction with respect to the center of the plot in which the data point lies depends on the comparison method result. In radar plots, high accuracy is represented by tightly grouped data points close to the center of the plot. The circle in dark green highlights the system accuracy limits of ISO 15197:2013 (± 15 mg/dl/± 15%)

