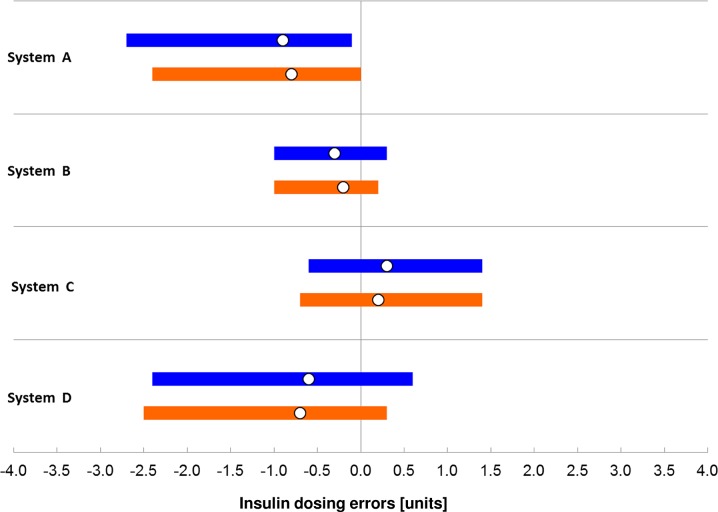
Fig. 3.
Modelled insulin dosing errors. Bars in blue (lay-users) and orange (study personnel) indicate ranges in which 99% of all dose errors were found, with the white circle showing the median dose error. Data are shown when evaluated against the respective manufacturer’s comparison method (hexokinase for system A, glucose oxidase for system B, C, D)

