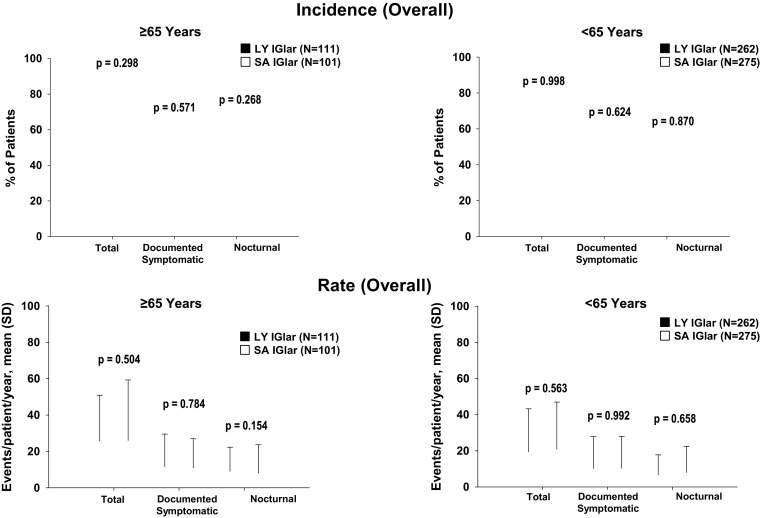
Fig. 4.

Overall incidence and rate of total, documented symptomatic, and nocturnal hypoglycemia in patients with type 2 diabetes ≥ 65 and < 65 years. Data for overall rate are presented as mean and SD. Hypoglycemia is defined as BG ≤ 3.9 mmol/L (70 mg/dL) or signs or symptoms of hypoglycemia. Overall refers to any time during the post-randomization visits. The treatment-by-age subgroup interaction values for the incidence of total, documented symptomatic, and nocturnal hypoglycemia are 0.362, 0.459, and 0.389, respectively. The treatment-by-age subgroup interaction values for rates of total, documented symptomatic, and nocturnal hypoglycemia are 0.737, 0.769, and 0.310, respectively. BG blood glucose, LY IGlar LY2963016 insulin glargine, SA IGlar insulin glargine, SD standard deviation
