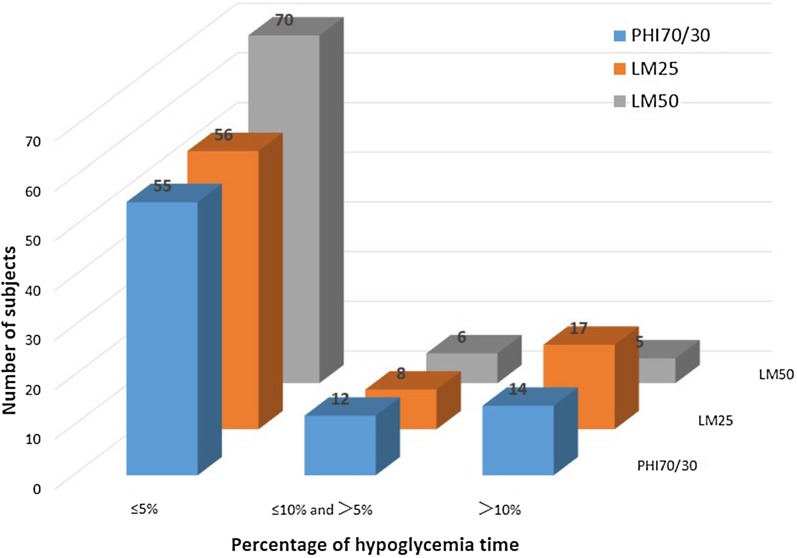
Fig. 6.
Frequency distributions of the percentage of time spent hypoglycemic during the whole day for patients on the three regimens. PHI70/30 vs LM25 vs LM50: P = 0.027; PHI 70/30 vs. LM25: P1 = 0.577; PHI 70/30 vs. LM50: P2 = 0.018; LM25 vs. LM50: P3 = 0.015. PHI70/30 premixed human insulin 70/30, LM25 insulin lispro mix 25, LM50 insulin lispro mix 50

