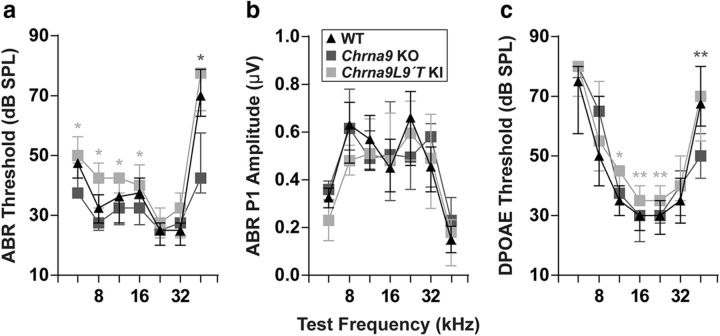
Figure 1.
Auditory function in unexposed WT, Chrna9 KO, and Chrna9L9′T KI mice. a, ABR thresholds for control WT (n = 12), Chrna9 KO (n = 14), and Chrna9L9′T KI (n = 15) mice at P21. b, ABR peak 1 amplitudes at 80 dB SPL. c, DPOAE thresholds in the same unexposed mice in the different genotypes. Cochlear thresholds are elevated in Chrna9L9′T KI ears, as measured by either ABRs (a) or DPOAEs (c). In all cases, median and interquartile ranges are shown, and the comparisons were made by a Kruskal–Wallis nonparametric ANOVA followed by a Dunn's post-test. Dark gray asterisks represent the statistical significance between Chrna9 KO and WT mice, and light gray asterisks between Chrna9L9′T KI and WT mice (*p < 0.05 and **p < 0.01).

