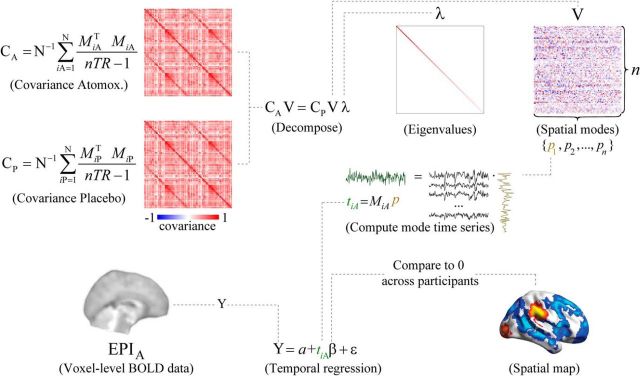
Figure 1.
Schematic overview of the spatial mode decomposition method. The covariance matrices CA and CP are submitted to generalized eigenvalue decomposition to produce a matrix of eigenvalues (λ) and eigenvectors (V). The decomposition equation as given here delineated modes that were more strongly expressed in the atomoxetine condition than in the placebo condition. To identify modes that were more strongly expressed in the placebo condition, the covariance matrices CA and CP were swapped. After decomposition, the participant-level time series (t) corresponding to each individual spatial mode (p) were computed for each run by projecting the mode onto the data (M). The number of brain regions in the parcellation scheme was denoted by n. A spatial map of brain regions that consistently covaried with the mode time series was computed by regressing the spatial mode time series for the atomoxetine (A) and placebo (P) conditions onto the voxel-level fMRI time series, and comparing the regression coefficients to zero across participants.

