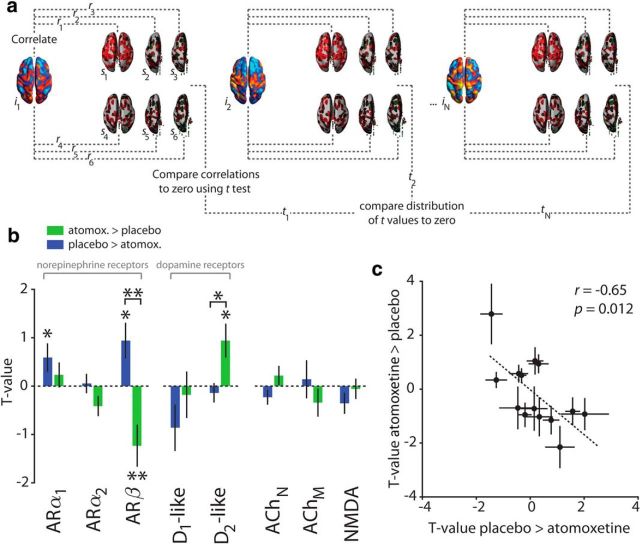
Figure 4.
Associations between spatial modes and catecholamine receptor gene expression. a, Correlation between individual spatial modes (i) and 6 postmortem samples (s). This procedure was repeated for each gene (for details, see Materials and Methods). b, Correlations between spatial modes and receptor gene expression maps. Within-mode significance is assessed by comparison with zero. AR, Adrenoceptor; ACh, acetylcholine receptor. *p < 0.05. **p < 0.01. c, Relationship of spatial mode versus catecholamine gene associations between both spatial modes. Error bars indicate SEM (N = 24 participants).

