FIGURE 3.

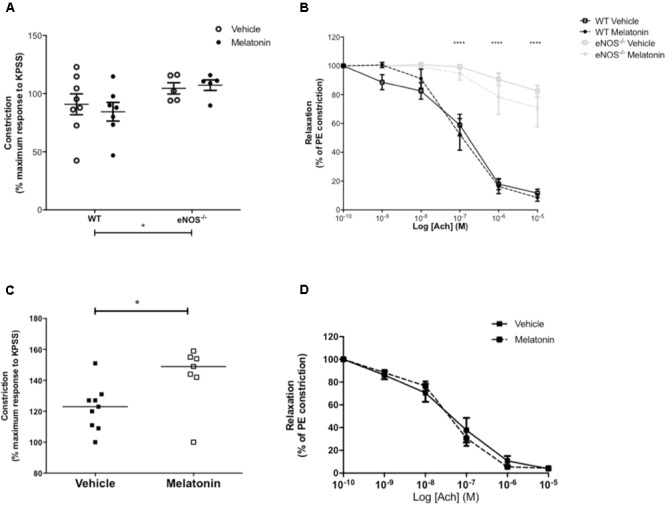
Constriction and relaxation responses of uterine arteries from WT and eNOS-/- mice (A,B) and P0+/+ and P0+/- mice (C,D) at embryonic day 18.5. (A,C) Constriction to 10-5 M phenylephrine shown as a percentage of the KPSS constriction; each dot represents a single animal, line denotes mean. (B,D) Dose dependent relaxation to acetylcholine is shown as a percentage of constriction to phenylephrine. Data are presented as mean ± SEM (A,B,D) or all data points with line denoting median (C). Number of mice were as follows; WT N = 8, eNOS-/- N = 5, for both vehicle and melatonin groups. For uterine arteries from P0 matings, N = 9 for vehicle and N = 7 for melatonin treated. Statistical analysis in (A,B) was carried out by two-way ANOVA to assess the effect of genotype and treatment with Bonferroni post-test to compare individual groups. In (C), a Mann–Whitney test was performed and in (D) a two-way ANOVA to assess the effect of treatment and [Ach]. ∗P < 0.05, ∗∗∗∗P < 0.0001 for effect of genotype independent of treatment.
