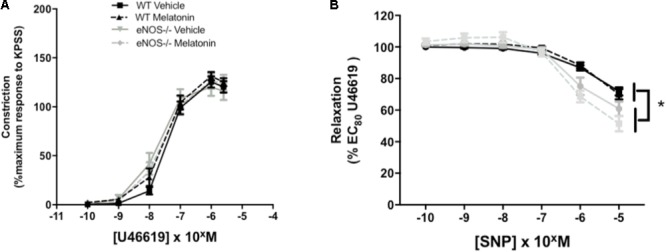
FIGURE 4.

Constriction and relaxation responses of umbilical arteries from WT and eNOS-/- mice at embryonic day 18.5. (A) Dose-dependent constriction to 10-10 to 2 × 10⁻⁶ M U46619 shown as a percentage of the maximum constriction to KPSS. (B) Dose dependent relaxation to sodium nitroprusside (SNP) is shown as a percentage of EC80 U46619 constriction. Data are presented as mean ± SEM. N’s as follows (N = litters, n = pups); WT vehicle N = 5, n = 20, WT melatonin N = 5, n = 17 eNOS-/- vehicle N = 5, n = 12, eNOS-/- melatonin N = 5, n = 17. Statistical analysis was carried out by two-way ANOVA to assess the effect of genotype and treatment with Bonferroni post-test to compare individual groups. ∗P < 0.05 WT vs. eNOS-/-.
